
Fig 8. Abundance ratio of amino acids in the subset of the top 5% most distorted residue pairs relative to the general population.
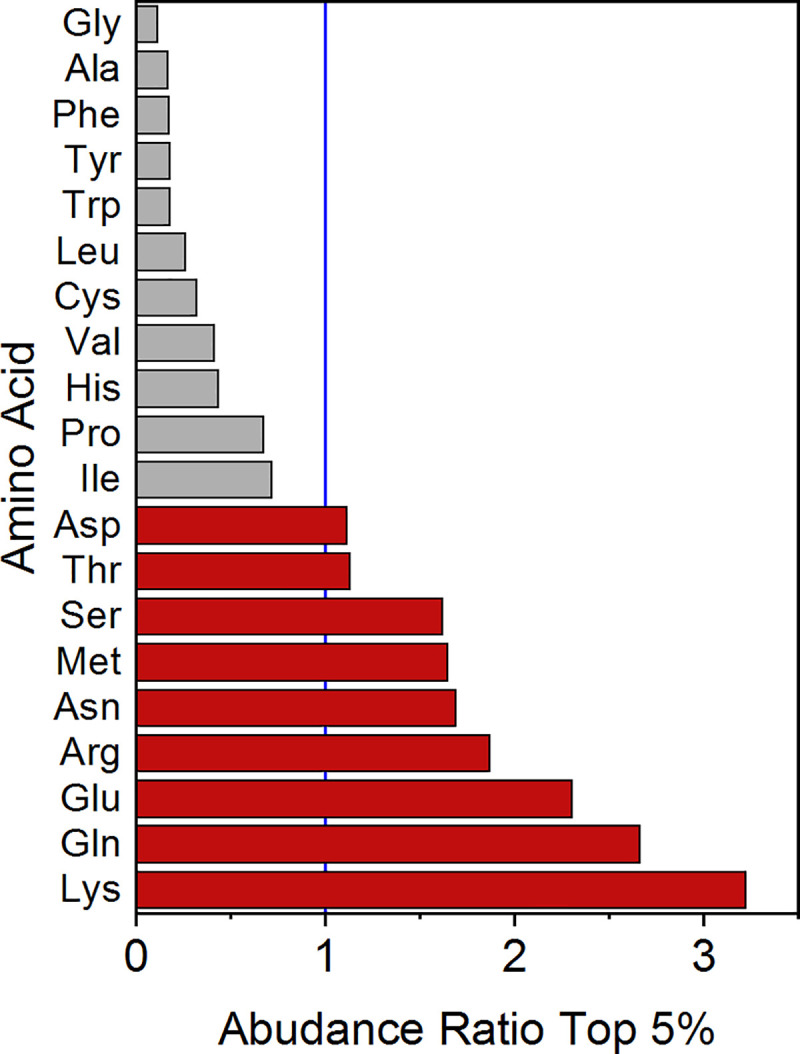
Blue line marks an abundance ratio of 1. Red bars: amino acids with abundance ratio >1. Gray bars: amino acids with abundance ratio <1.