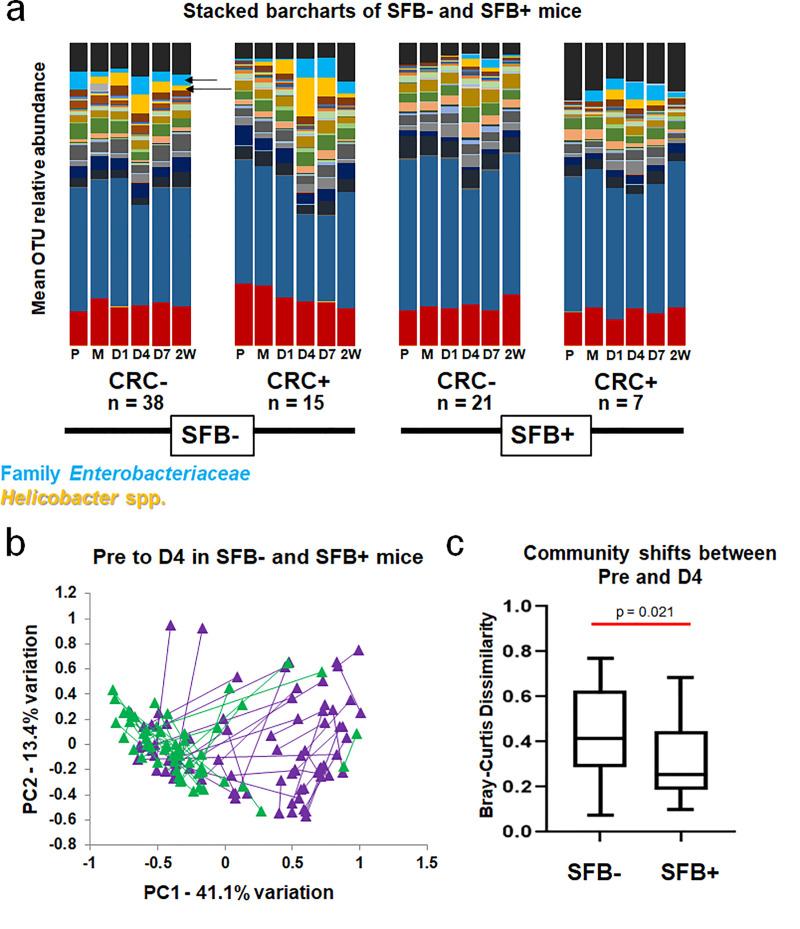
Fig 3. SFB stabilizes the GM and prevents large shifts in GM structure following Helicobacter spp. inoculation.
A) Relative abundance of OTUs within CRC+ and CRC- mice in SFB- and SFB+ groups, shown as group means at pre-inoculation (P), after the first inoculation (M), and at day 1 (D1), D4, D7, and two weeks (2W) PI. Yellow-orange represents Helicobacter spp. (including Helicobacter ambiguous taxa and Helicobacter uncultured bacterium) and light blue represents Family Enterobacteriaceae (more specifically denoted as Escherichia-Shigella Escherichia sp.). These are indicated by arrows. B) Principal Component Analysis (PCA) of Pre and D4 samples of each mouse in SFB+ (green) and SFB- (purple) groups. Length of line denotes overall change in composition from Pre to D4 in each mouse. C) Mean (±SD) shifts in GM community shown in B, using Bray-Curtis Dissimilarity Index. Mann-Whitney Rank Sum test p = 0.021.

