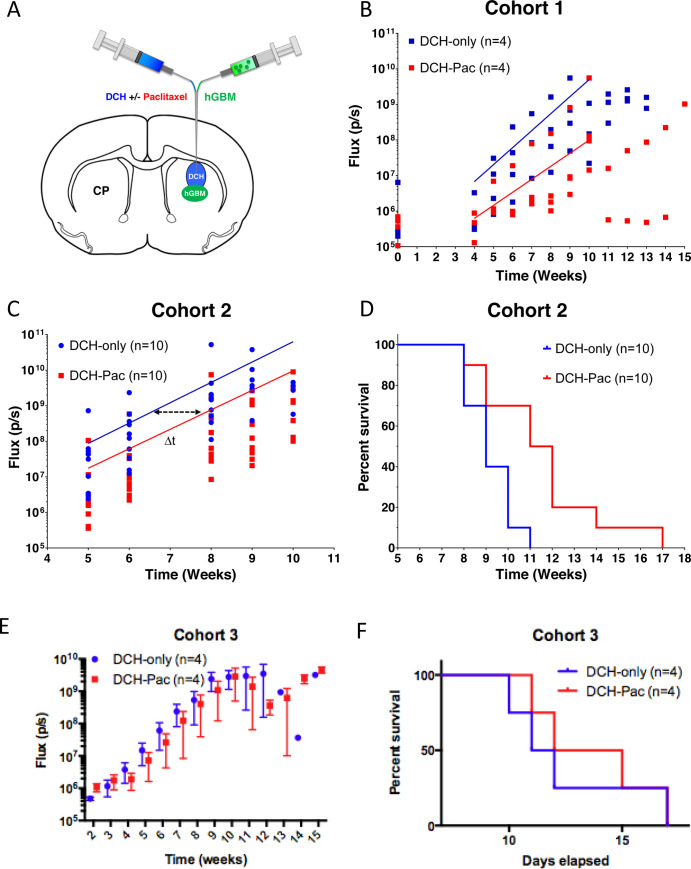
Fig 4. DCH-paclitaxel reduces hGBM growth progression rates monitored by luciferase bioluminescence imaging in vivo and prolongs survival.
A. Schematic of the mouse brain identifying the anatomical location of the gliomasphere and then DCH injections within the caudate putamen (CP) region of the striatum. B and C. Graphs showing Luciferase Total Flux (p/s = photons/second) progression as a function of time as measured by bioluminescence IVIS imaging for each animal receiving either DCH only or DCH-paclitaxel in cohort 1 (n = 4 animals per group) (B) or cohort 2 (n = 10 animals per group) (C). An exponential growth regression was applied to each treatment group in B and C which is represented by a straight line on the semi-log plot. The delta t (Δt) is the time between the same absolute average flux value between the two treatment groups and was calculated to be approximately 1.5 weeks for cohort 2 D. Kaplan Meyer survival curve for cohort 2 animals which demonstrated that DHC-paclitaxel conferred a significant median survival time increase of 2.5 week (or a 23% extension of life) compared to the DCH alone (p = 0.0063). Statistic calculated by log rank test calculated by Prism 6 software. E. In a third cohort, animals were injected with gliomasphere cells followed by DHC two weeks later. The effect was smaller and the survival curve did not meet statistical significance.

