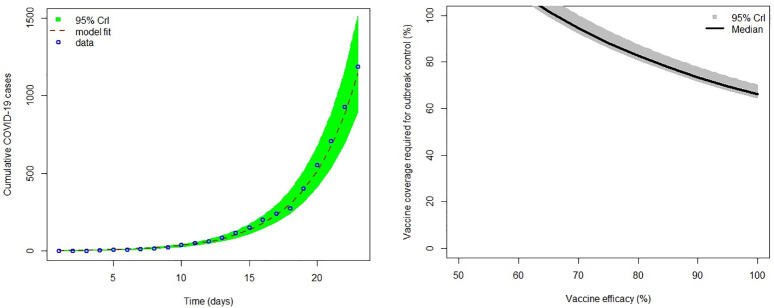
Fig 2.
(a) Shows COVID-19 model fitting to cumulative cases where the green region is the 95% CrIs, the dashed brown line is the best model fit and the blue circles are the reported data for the cumulative number of COVID-19 cases in South Africa. (b) Shows the sensitivity analysis plot showing different vaccination coverages for different COVID-19 vaccine efficacy for South Africa. The dark grey regions are the 95% CrIs and the black line is the median.

