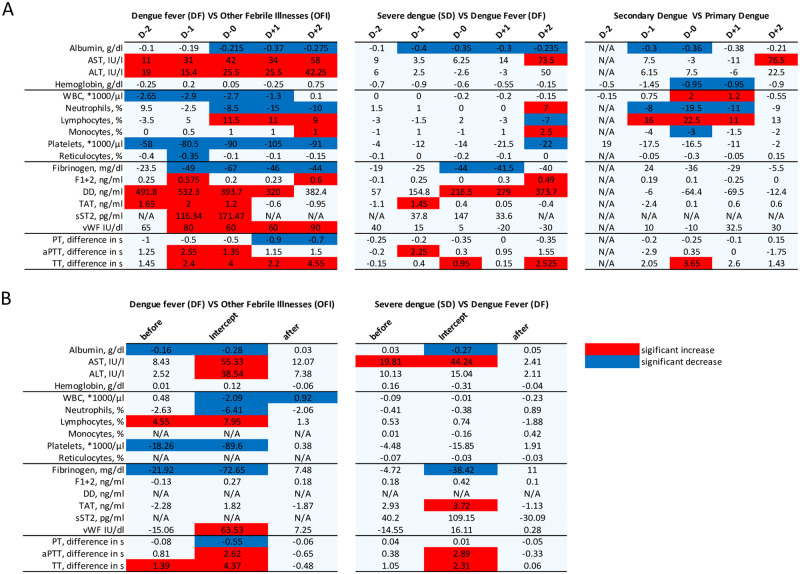
Fig 2. Overview of the blood biomarkers changes between the different groups.
A. Significant changes in blood markers for each day using Mann-Whitney U test. D0 represent the day of defervescence. In the comparison dengue VS other febrile illnesses, dengue comprises both dengue fever and severe dengue cases. B. Significant changes in blood biomarkers kinetic and intercept using the piecewise linear mixed effect regression model. Before and after represent two slopes while intercept is the biomarker’s value on D0. Blue, significant decrease. Red, significant increase.

