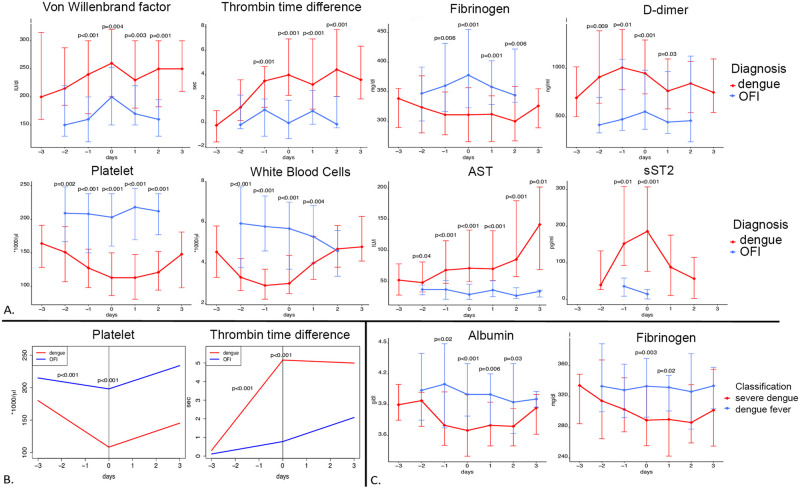
Fig 3. Evolution of selected blood biomarkers for selected groups comparison over the course of disease.
A. Evolution of the medians (and interquartile ranges) with comparison between dengue and other febrile illness patients. B. Evolution of the biomarkers at patient level using piecewise linear mixed effects models with comparison between dengue and other febrile illness patients. C. Evolution of the medians (and interquartile ranges) with comparison between dengue fever and severe dengue patients. In A and C, the linking lines are displayed for a better visualization but do not represent the evolution of the biomarkers at patient level. D0 is the day of defervescence.

