Figure 4.

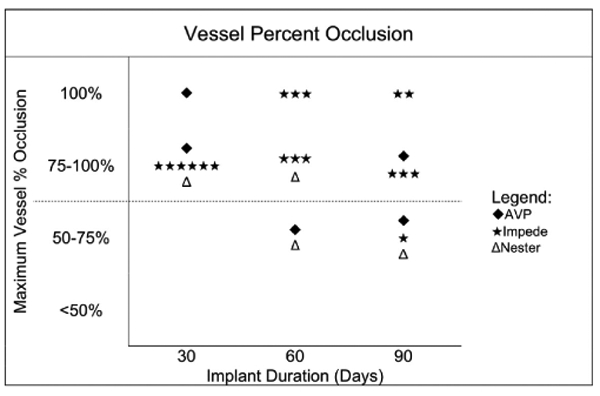
Maximum vessel percent occlusion for each device type at each time point. Each vessel is only represented once in this chart. The dotted line indicates the occlusion threshold for a potential downstream ischemic therapeutic effect.

Maximum vessel percent occlusion for each device type at each time point. Each vessel is only represented once in this chart. The dotted line indicates the occlusion threshold for a potential downstream ischemic therapeutic effect.