
FIGURE 2.
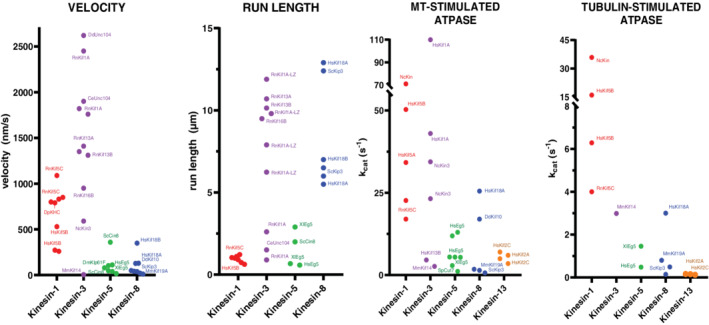
Motor specifications of kinesin families. Each data point corresponds to a reported value from an independent published experiment. Select motors are labeled. Values were obtained from: kinesin‐1, 33 , 34 , 35 , 36 , 37 , 38 , 39 , 40 , 41 , 42 , 43 , 44 kinesin‐3, 32 , 33 , 34 , 37 , 40 , 42 , 43 , 45 , 46 , 47 , 48 , 49 , 50 , 51 kinesin‐5, 41 , 52 , 53 , 54 , 55 , 56 , 57 , 58 , 59 , 60 , 61 , 62 , 63 , 64 kinesin‐8, 35 , 38 , 65 , 66 , 67 , 68 , 69 , 70 , 71 , 72 , 73 , 74 , 75 , 76 and kinesin‐13. 77 , 78 , 79 Note that several run length values for kinesin‐3 and ‐8 were limited by the length of MTs assembled in vitro