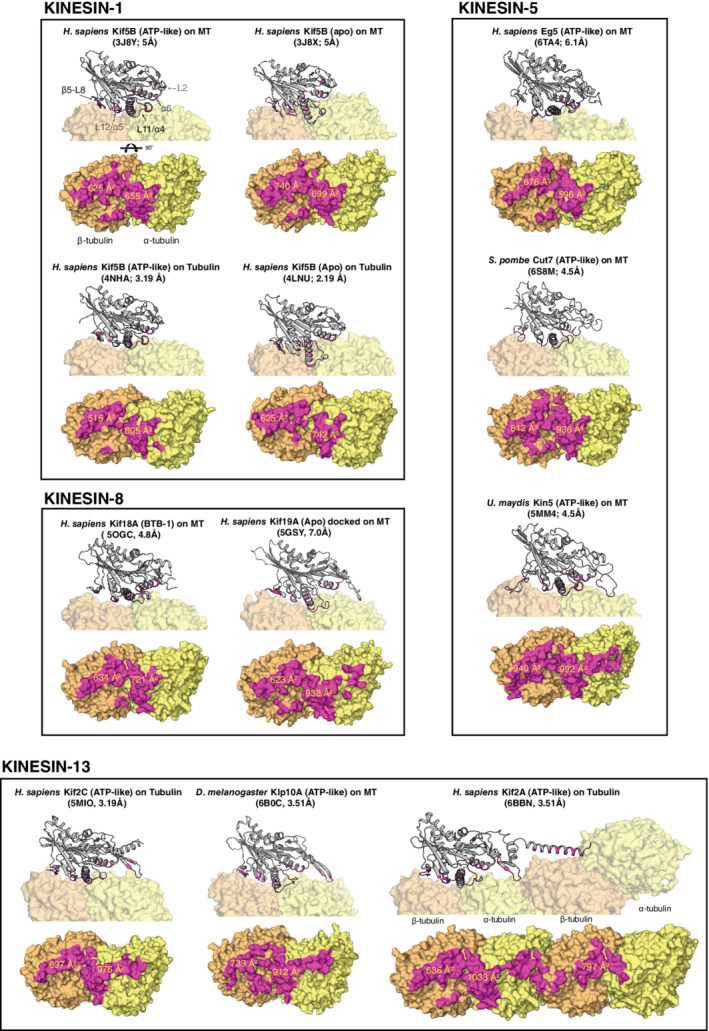
FIGURE 3.

Microtubule‐binding surfaces for select families of kinesins. Kinesin structures are displayed as cartoons and tubulin is shown as surface representations. Interfaces were identified with ePISA 107 and are colored magenta. Values for buried surface are were calculated by ePISA using coordinate files retrieved from the Protein Data Bank (https://www.rcsb.org/). Nucleotide state, PDB IDs, and the overall map resolution for each structure are shown in parentheses
