
FIGURE 1.
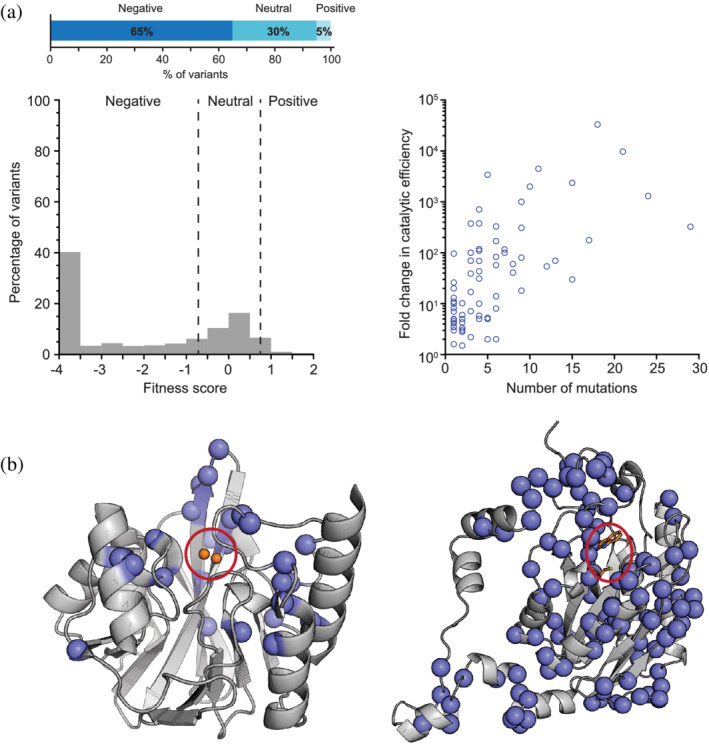
A global view of the distribution of activity‐enhancing mutations. (a) Histogram of the distribution of fitness effects for all missense mutations in the enzyme VIM2 under selection for growth at 128 μg/ml of ampicillin. The dashed vertical lines indicate fitness score cutoffs used to classify fitness effects as positive, neutral, or negative. The bar graph at the top indicates the total percentage of positive, neutral, or negative variants. (b) Cartoon representations of the crystal structures of VIM2 65 (left, PDB ID: 5yd7) and amiE 62 (right, PDB ID: 2uxy) with the positions of all activity‐enhancing mutations highlighted as blue spheres. Red circles indicate the location of the active site. The active site Zn2+ ions of VIM2 are depicted as orange spheres, whereas two active site residues of amiE, Trp138 and Cys166, are depicted as sticks. (c) Fold‐change in k cat/K M of several evolved enzymes against the number of missense mutations acquired during directed evolution. Panel A is adapted from Ref. 65, Panel C from Ref. 62