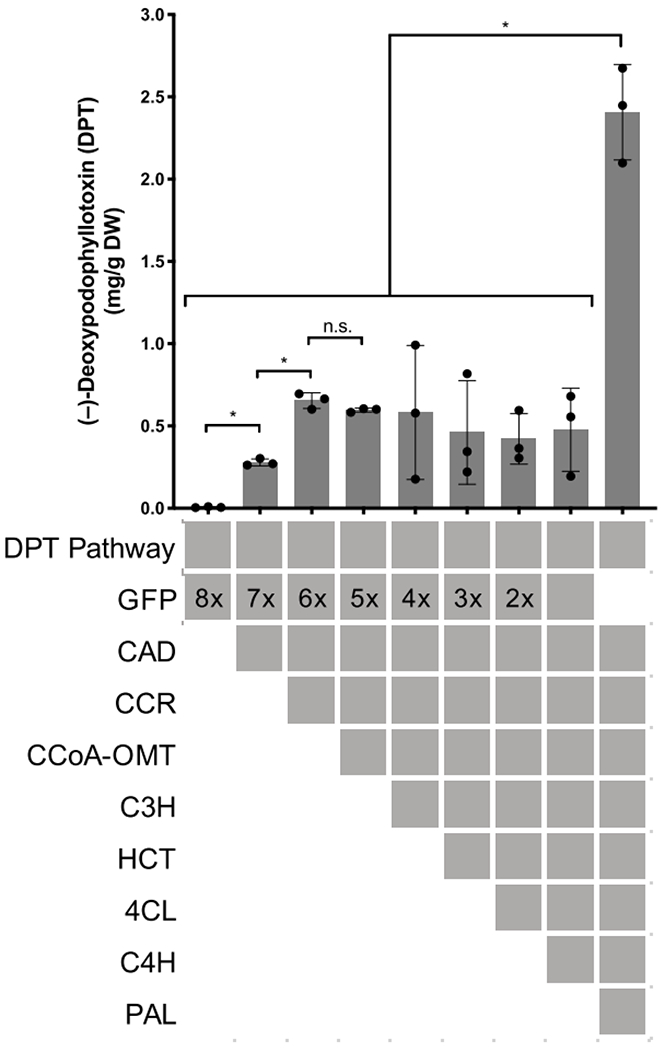
Figure 2.

Impact of individual CA pathway enzyme expression on DPT yield in planta according to LC-MS of extracts from Agro.- infiltrated tobacco. Gray bar height indicates mean (error bars show ± SD); individual biological replicates are represented as dots. Asterisks indicate a significant difference between sets, p < 0.05. Gray-shaded boxes indicate enzymes expressed via Agro.-infiltration, with numbers showing the amount of the GFP-expressing strain used relative to the other strains.
