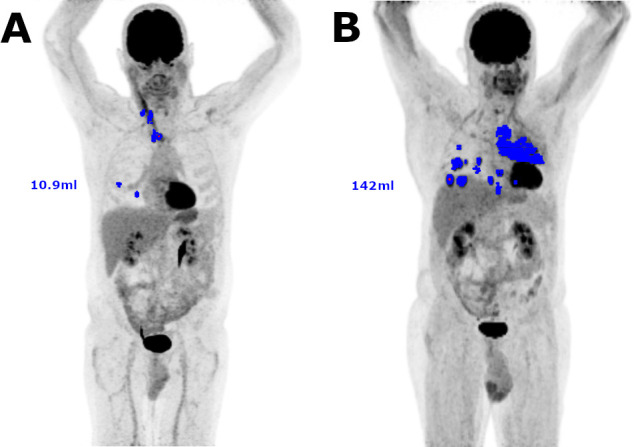
Figure 1.

Examples of 18F-FDG PET/CT tumor segmentations for MTV measurement. Included voxels are represented in blue on MIP images. (A.) Example of a small MTV (10.9 mL). (B) Example of a large MTV (142 mL). 18F-FDG PET/CT, 18F-fluorodeoxyglucose positron emission tomography–computed tomography; MIP, maximum intensity projection; MTV, metabolic tumor volume.
