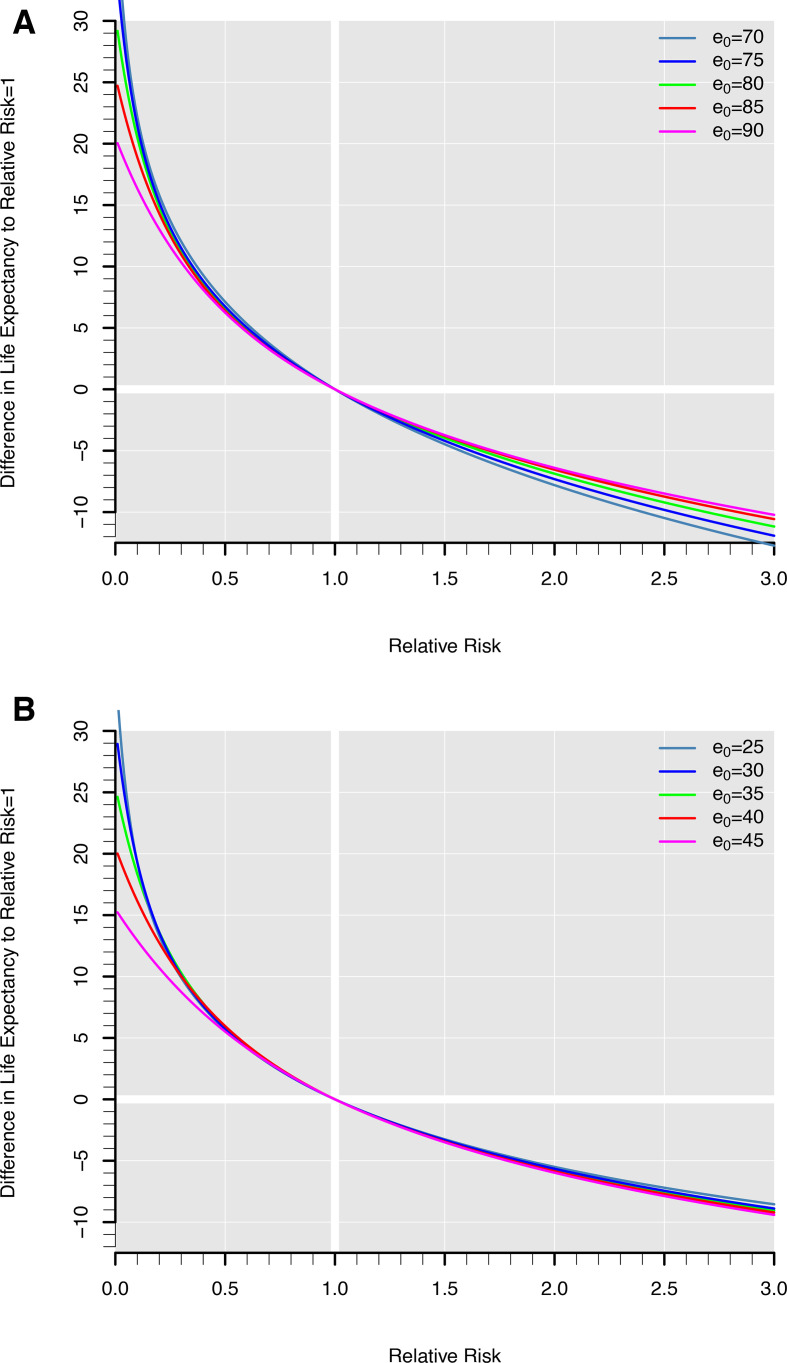
Figure 2.
Gains in life expectancy (LE) at birth (A) and at age 50 (B) for different values of relative risks under five different levels of LE. Calculations are based on Swedish life tables for women and men combined for the 5-year period 2010–2014 (to avoid random fluctuations due to sampling variability). The data were downloaded on 9 July 2018, from the Human Mortality Database.5 The death rates were adjusted to the desired level of LE at birth (70, 75, 80, 85, 90) or remaining LE at age 50 (25, 30, 35, 40, 45) by shifting the age trajectory of death rates up or down. Next, the death rates were multiplied with factors ranging from 0 to 3 (with increments of 0.01) and estimated the corresponding differences in LE to the baseline mortality risk (relative risk=1). All life tables estimates are based on standard methodology.

