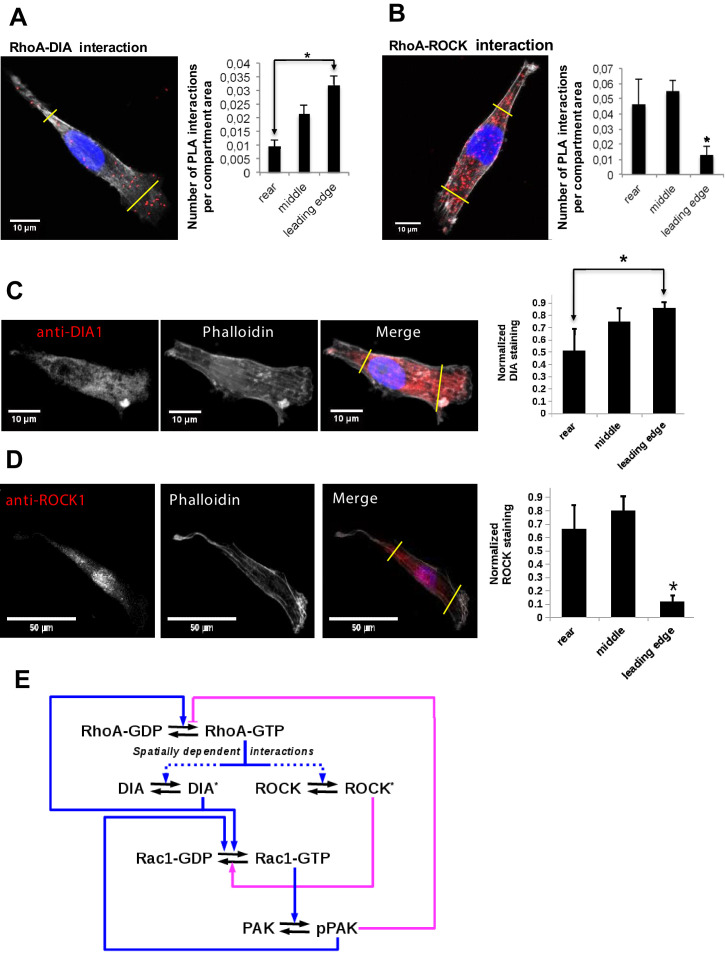
Figure 1. Differential localization of the RhoA-DIA and RhoA-ROCK1 protein complexes determine spatially resolved signaling topology.
(A, B) Representative PLA images. Each red spot within a cell represents a fluorescent signal from a single RhoA-DIA1 (A) or RhoA-ROCK1 (B) complex. Yellow lines indicate bounds for the leading edge, intermediate region and rear. Bar graphs at the right show the average density of these complexes in different cell regions (the rear, middle and leading edge)± S.E.M. of four independent experiments with 25 cells analyzed per experiment. The asterisk * indicates that p<0.05 calculated using unpaired t-test. (C, D) Representative images of DIA1 and ROCK1 immunostaining. Bar graphs at the right show quantified immunostaining density signals for different cellular compartments ± S.E.M. of four independent experiments with one cell analyzed per experiment. The asterisk * indicates that p<0.05 calculated using unpaired t-test. (E) A schematic wiring diagram of the RhoA-Rac1 network, showing positive (blue) and negative (magenta) feedback loops. Spatially varying RhoA interactions with its effectors DIA and ROCK are shown by dashed lines.


