
Figure 2. A mathematical model of the RhoA-Rac1 network predicts dramatically distinct dynamic regimes for different DIA and ROCK abundances.
(A) Distinct dynamic regimes of the RhoA-Rac1 network dynamics for different DIA and ROCK abundances. Oscillations of RhoA and Rac1 activity exist within area 1 (regime 1). In area 3, sustained GTPase oscillations and a stable steady state with high RhoA and low Rac1 activities coexist. Regimes 0, 2, 5 and 6 have only one stable steady state. Notably, regime 2 is excitable. Steady state solutions with high RhoA activity exist in areas 2–4, and 6–8. Stable steady state solutions with high Rac1 activity exist in areas 0 and 5–8. Regimes 4, 7 and 8 are bistable with two stable steady states. (B, C) Wiring diagrams of the RhoA-Rac1 network for the cell leading edge (B) and the cell body and rear (C). Dashed blue lines indicate weak activating connections. (D–F) Typical time courses of RhoA and Rac1 activity in regimes 1 (D), and 2 (E). (F) In area 3, depending on the initial state, the GTPase network evolves either to a stable steady state (right) or a stable oscillatory regime (left).
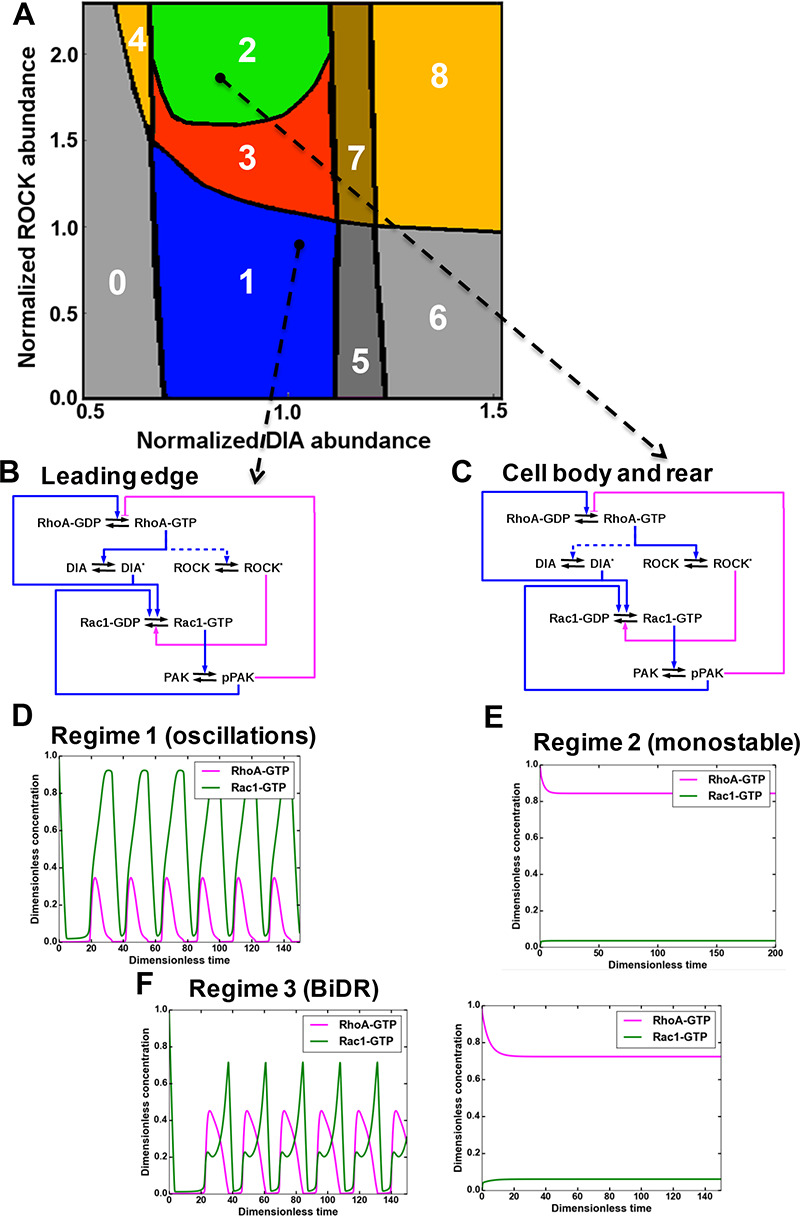
Figure 2—figure supplement 1. Distinct dynamic regimes of the RhoA-Rac1 network for different effector abundances.

Figure 2—figure supplement 2. Nullclines and vector fields describing the nine dynamic regimes of RhoA-GTP and Rac1-GTP shown in Figure 2A.

Figure 2—figure supplement 3. One-parameter bifurcation diagrams for changing ROCK and DIA abundances separately in Figure 2A.
