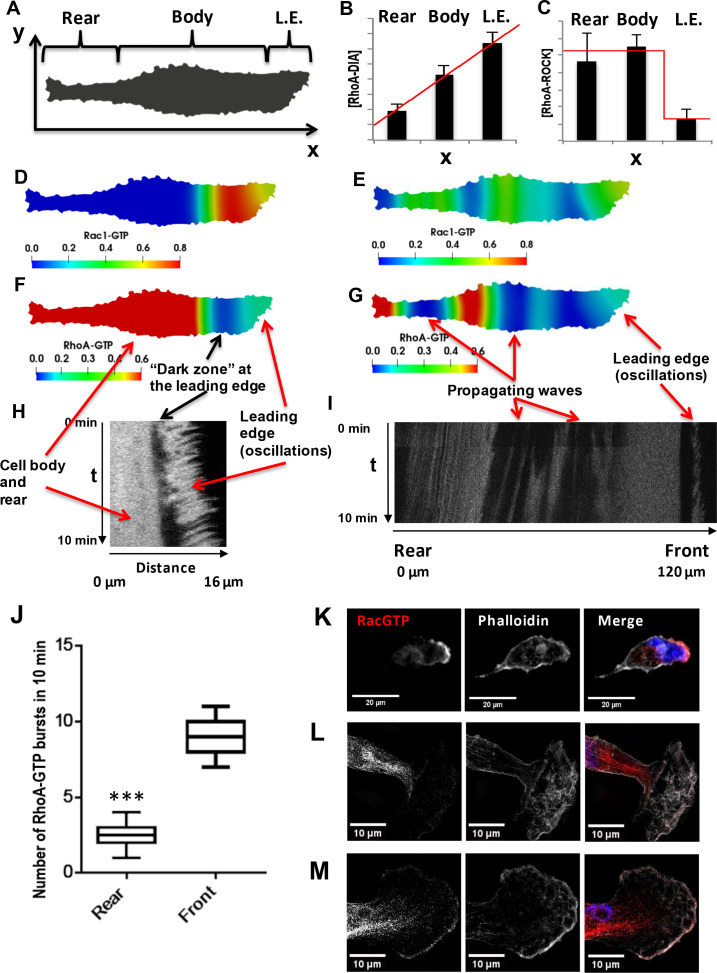
Figure 3. Spatial propagation of RhoA and Rac1 activities during cell motility.
(A) A 2-D calculation domain obtained by digitizing cell images. Different cellular compartments are indicated. The x-axis represents the direction of cell polarization, the y-axis represents the perpendicular direction. (B, C) The abundance profiles of DIA and ROCK used in simulations (red lines) are superimposed on the experimental spatial profiles (bar graphs in Figure 1C and D). (D–G) Model-predicted spatial patterns of the RhoA and Rac1 activities for different phases of the cell movement cycle. (D, F) Rac1 and RhoA activity snapshots during a protrusion-retraction cycle at the leading edge (t = 175 s from the start of the moving cycle). (E, G) represent snapshots when the Rac1 and RhoA activity wave have spread over the entire cell, reaching the rear (t = 1518 s). (H) The RhoA activity at the leading edge and cell body during a protrusion-retraction phase measured by RhoA FRET probe in space and time. The arrows compare model-predicted and experimentally measured patterns, indicating zones of RhoA oscillatory and high constant activities and a ‘dark zone’ of low RhoA activity. (I) Spatiotemporal pattern of the RhoA activity during further RhoA wave propagation into the cell. (J) The number of RhoA activity bursts at the cell body and rear during 10 min measured using the RhoA FRET probe. Error bars represent 1st and 3rd quartiles, *** indicate p<0.001 calculated using unpaired t-test. (K–M) Fluorescent microscopy images of Rac1 activity (red), combined with staining for F-actin (phalloidin, white) and the nucleus (DAPI, blue) in fixed cells for different phases of the cell movement cycle; (K) a protrusion-retraction cycle at the leading edge, and (L, M) present Rac1 activity wave propagation into the cell body. The images (L, M) were obtained by super-resolution microscopy.


