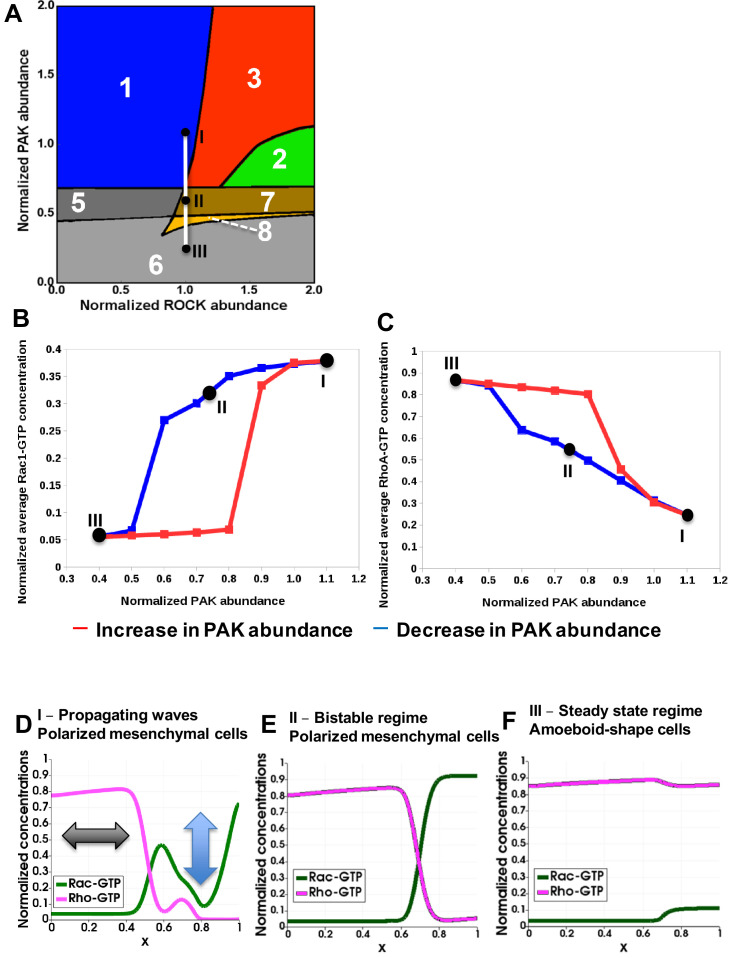
Figure 4. Hysteresis of the RhoA and Rac1 activities are manifested upon PAK inhibition and recapitulated by a spatiotemporal model.
(A) Distinct dynamic regimes of the RhoA-Rac1 network for different DIA and ROCK abundances. Colors and numbers of dynamic regimes are the same as in Figure 2A. (B, C) Model-predicted dependencies of the RhoA and Rac1 activities on the PAK abundance for gradually decreasing (blue) and increasing (red) PAK abundances. The network evolution occurs through two different routes (blue and red curves in B and C). It is calculated by averaging the GTPase activities over the time and cell volume based on western blot data reported in our previous study (Byrne et al., 2016). Points I, II and III shown in black (A) are also indicated on the network trajectories (B, C). (D–F) Snapshots of simulated RhoA-GTP and Rac1-GTP spatiotemporal patterns that emerge for different PAK abundances are shown for a 1-D section of a cell. The x axis corresponds to the normalized cell length (Figure 3A). Arrows in panel (D) illustrate oscillations and the wave propagation along a cell.


