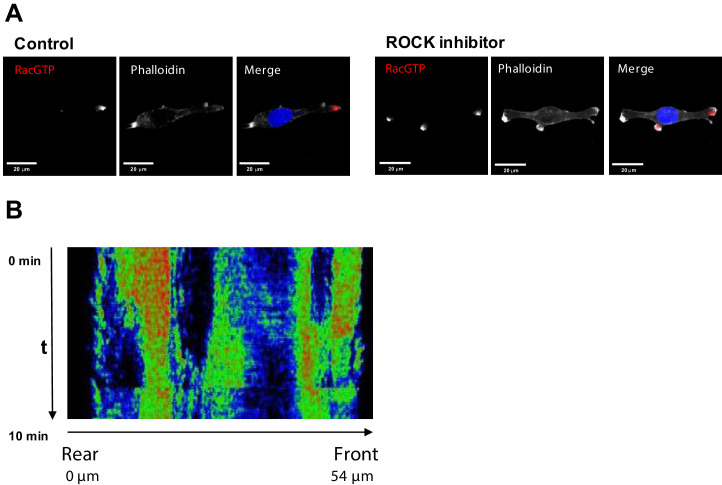
(
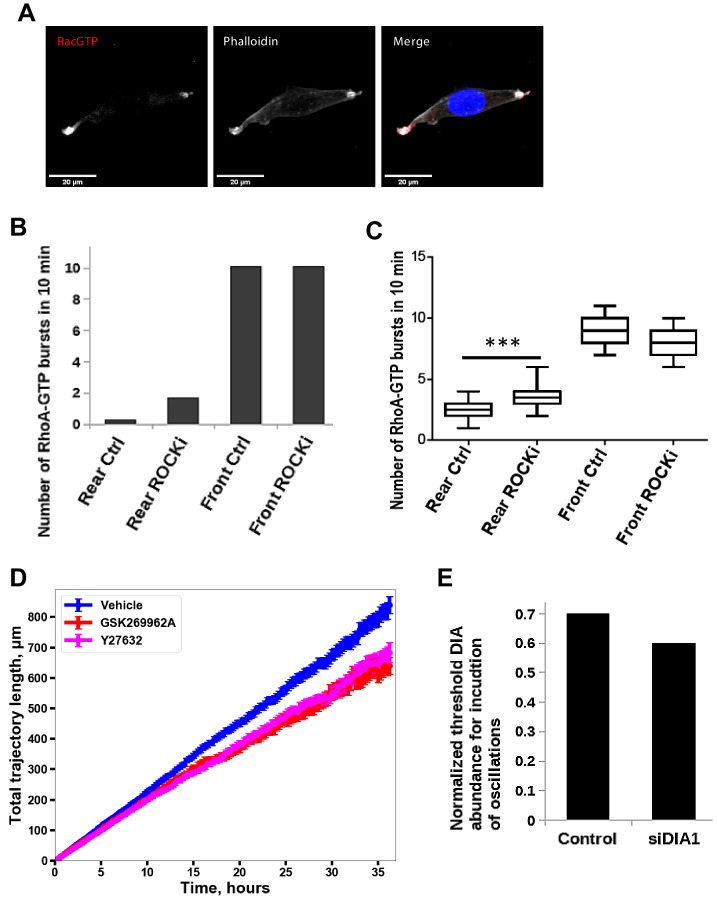
A) A different biological replicate of fluorescent microscopy image of Rac1 activity (red), and F-actin (phalloidin, white) and nuclear (DAPI, blue) staining in fixed MDA-MB-213 cells treated with 2.5 µM Y-27632 ROCK inhibitor for 15 min. (
B) Model-predicted numbers of RhoA activity bursts during 10 min at the leading edge and the rear for control cells and cells where ROCK was inhibited by 2.5 μM of Y-27632. (
C) The number of experimentally observed RhoA activity bursts during 10 min measured using the RhoA FRET probe at the leading edge and the rear for control cells and cells treated with the ROCK inhibitor Y-27632. Error bars represent 1st and 3rd quartiles, asterisks *** indicate p<0.001 calculated using unpaired t-test. (
D) Quantification of the total distance travelled by the control cells and cells treated with a ROCK inhibitor. Results were similar for two different ROCK inhibitors, 10 μM Y-27632 and 1 μM GSK269962A. (
E) Model predicted lower threshold of DIA abundance for induction of RhoA-Rac1 oscillations (region 1 in
Figure 2A) in control and DIA knockdown conditions. DIA knockdown conditions were modeled by changing of RhoA and Rac1 abundance according to experimental data (
Figure 1—figure supplement 1, panels A and B).


