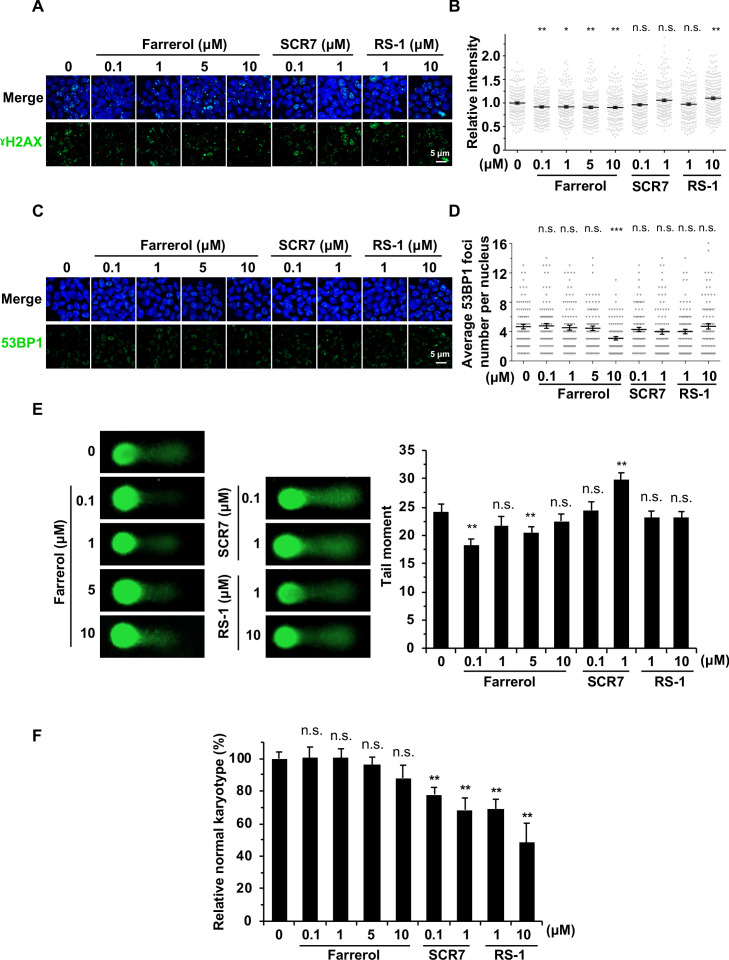
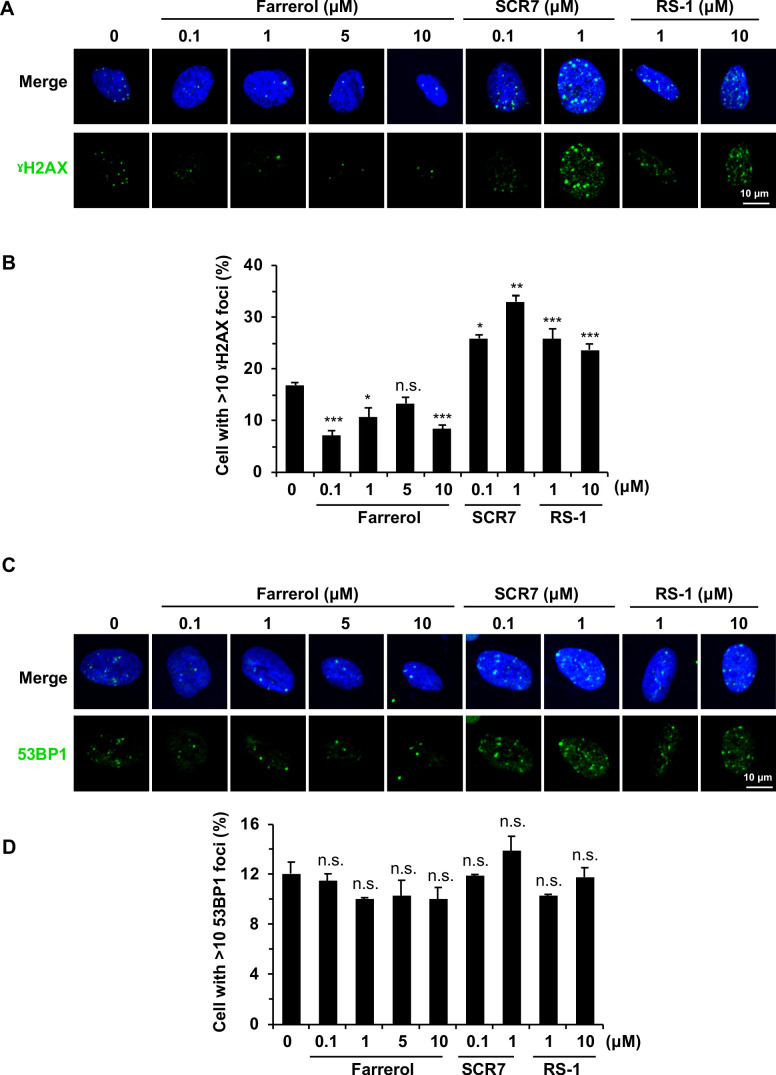
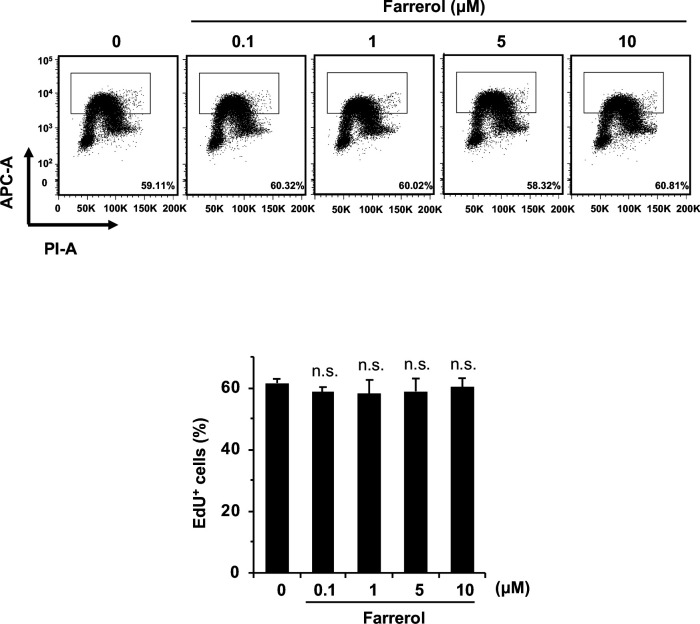
Figure 4. The effects of small molecule treatment on genomic stability in mouse ESCs.
(A) Representative images of γH2AX immunostaining in mouse ESC E14 treated with indicated doses of small molecules. (B) Analysis of relative intensity of γH2AX in mouse ESCs in (A). The results were normalized to those in control group. Each dot represents the relative fluorescence intensity of a single nucleus. (n ≥ 180 single nucleus). (C) Representative images of 53BP1 immunostaining in mouse ESC E14 treated with indicated doses of small molecules. (D) Quantification of 53BP1 foci numbers in (C). At least 50 cells were included for each group. (E) Representative images of alkaline comet assay of mouse ESC E14 treated with indicated doses of molecules for 24 hr (left panel). The tail moments of at least 50 cells for each group were quantified using Cometscore software (Sumerduck, VA, USA) (right panel). (F) Karyotyping analysis indicated that 48 hr farrerol treatment post spCRSIPR/Cas9 mediated editing did not greatly affect karyotypes (40, XY) of the Oct4-ΔPE-GFP transgenic C57BL/6 × PWK ESCs. Error bars in (B), (D) and (E) represent the s.e.m. Error bars in (F) represent the s.d. *p<0.05, **p<0.01, ***p<0.001, n.s., not significant, t-test.


