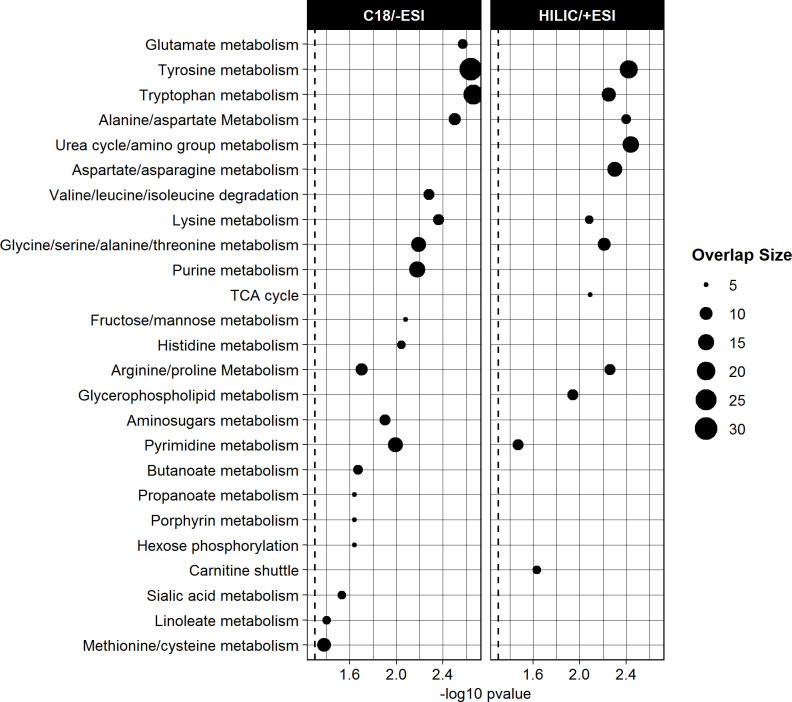
Figure 3.
Results from pathway analysis in Mummichog of the m/z features in the hepatic fat community. Dotted vertical lines indicate p<0.05. All pathways shown in the figure were significantly enriched based on p<0.05 based on permutation testing and consisted of at least five overlapping features. There were no significantly enriched pathways meeting these predetermined thresholds for the other abdominal fat communities. ESI, electrospray ionization; HILIC, hydrophilic liquid interaction chromatography; m/z, mass to charge ratio; TCA, tricarboxylic acid.

