
Figure 16.
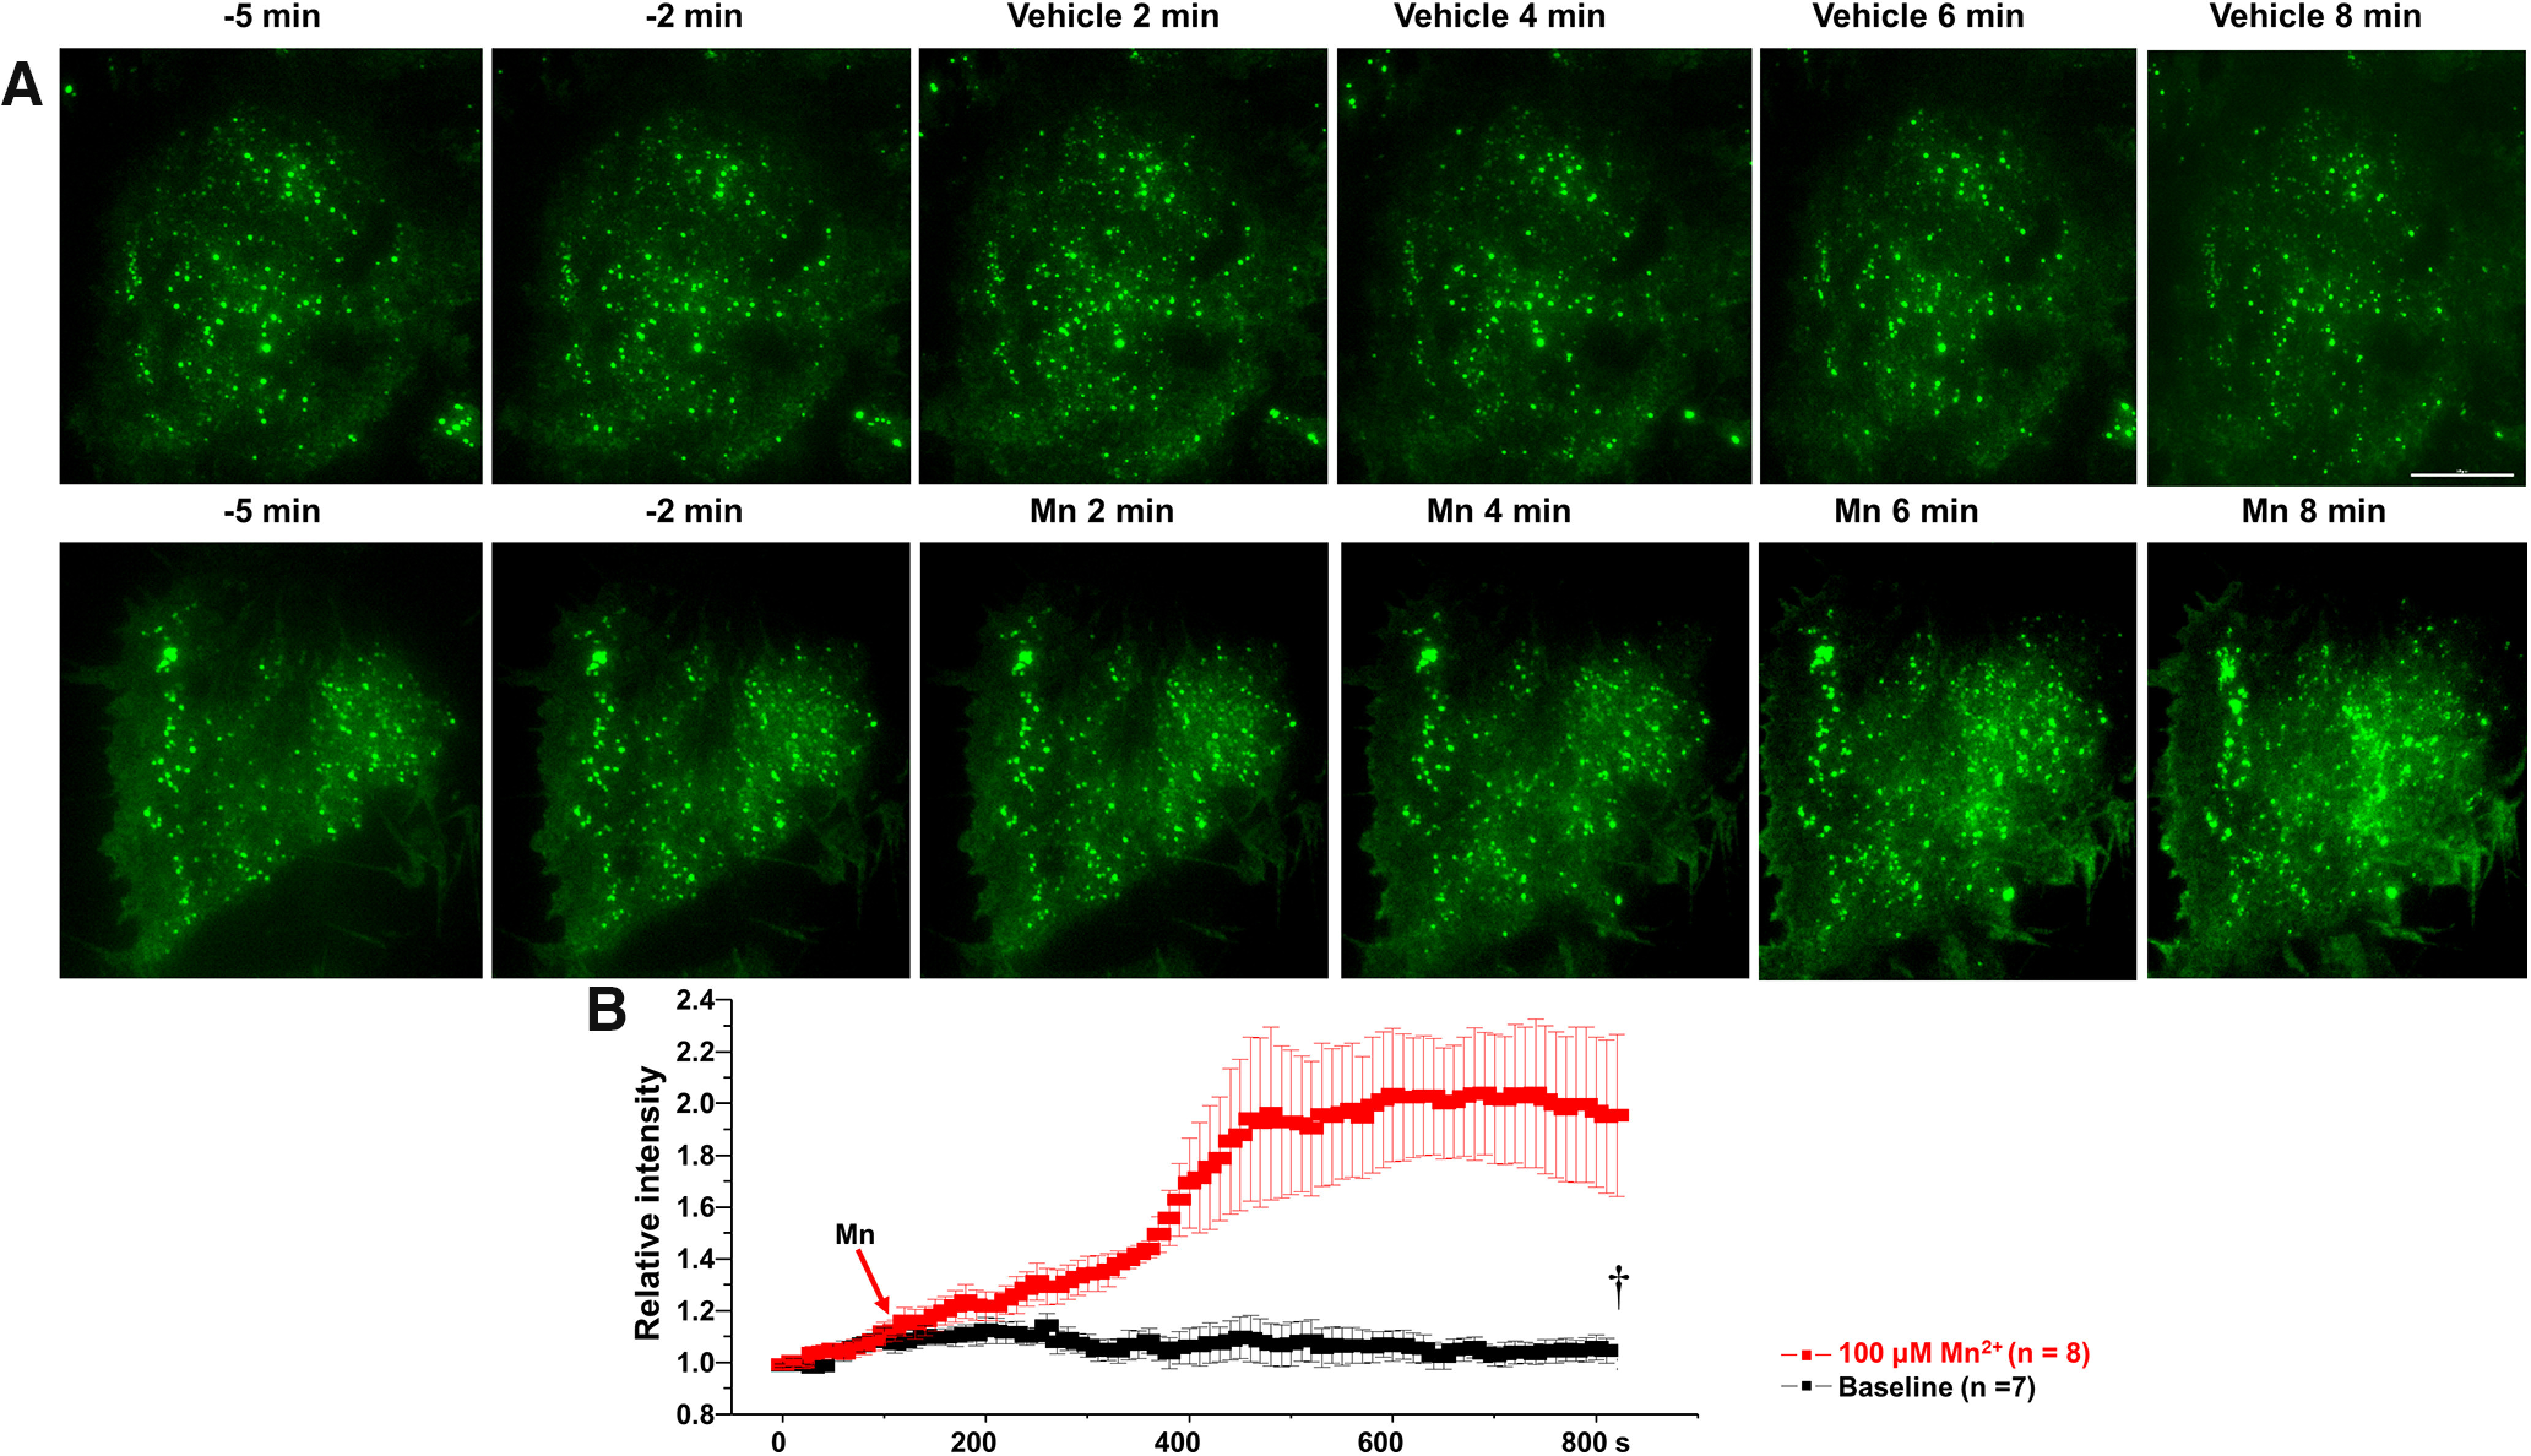
Membrane localization of BK GFP α subunit is increased following manganese exposure. A, Representative TIRF microscopy images of GFP α subunit following vehicle or 100 μm Mn2+ treatments. B, Analyses of relative fluorescence intensities at the surface membrane following vehicle or 100 μm Mn2+. Scale bar, 20 μm. †p < 0.01.