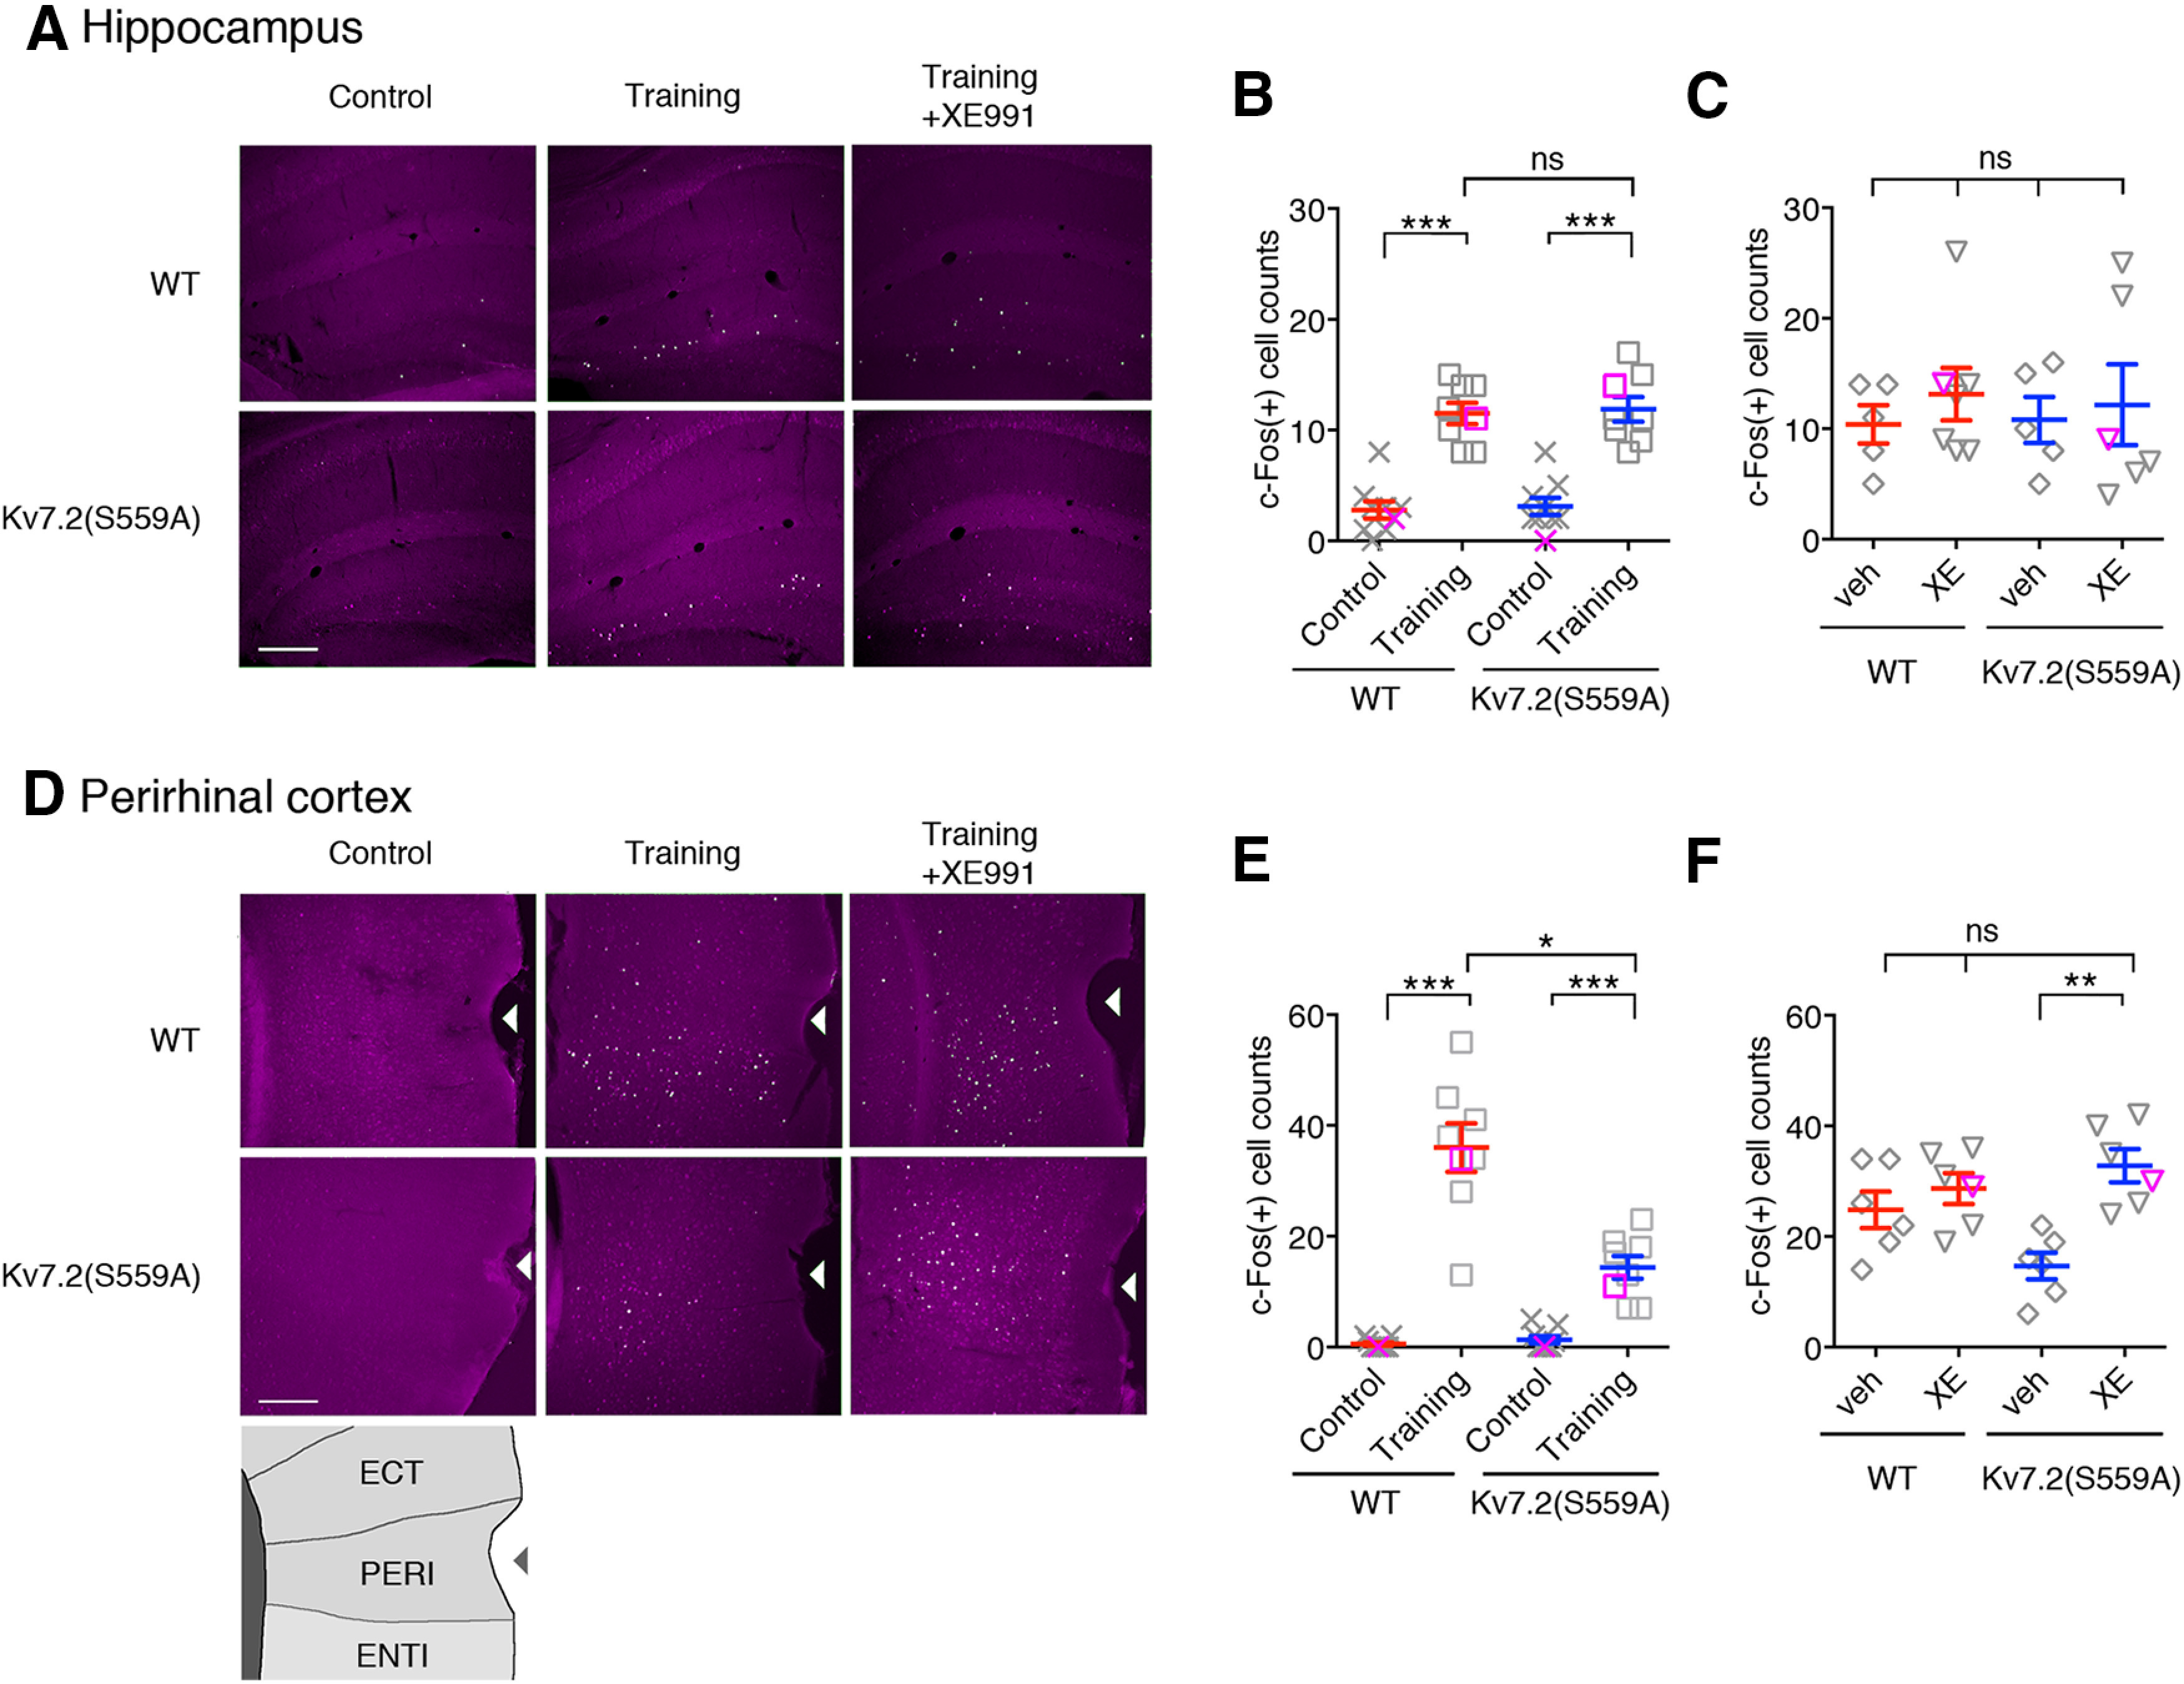
Figure 7.

c-Fos immunostaining showing the hippocampus and the perirhinal cortex. A, Coronal brain sections showing c-Fos induction in the hippocampus from WT and Kv7.2(S559A) mice from control, 2 h after training, and 2 h after training with post-training administration of XE991 (Training+XE991). Magenta shows signal of c-Fos staining and white/green shows pixels that exceeded 4× tissue background used to determine c-Fos-positive cells. Scale bar, 200 µm. B, Summary of c-Fos-positive cell number in the hippocampus without training (control) and after training. C, Summary of c-Fos-positive cell numbers showing effects of post-training administration of XE991 in the hippocampus. The veh control and XE991 (XE) are indicated. D, Coronal brain sections showing c-Fos induction in the lateral cortex area surrounding the perirhinal cortex. The rhinal fissure is indicated by arrowheads. Schematic drawing showing cortical structures surrounding the rhinal fissure is shown at the bottom. ECT, Ectorhinal area; PERI, perirhinal area; ENTI, entorhinal area. Scale bar, 200 µm. E, Summary of c-Fos-positive cell numbers in the perirhinal cortex in control and after training. F, Summary of c-Fos-positive cell numbers in the perirhinal cortex showing the effects of post-training administration of XE991. Each data point represents a different animal. Magenta symbols in scatter plots indicate data shown in panel A & D. Results are shown as the mean ± SEM. *p < 0.05; **p < 0.01; ***p < 0.001; ns, p > 0.05.
