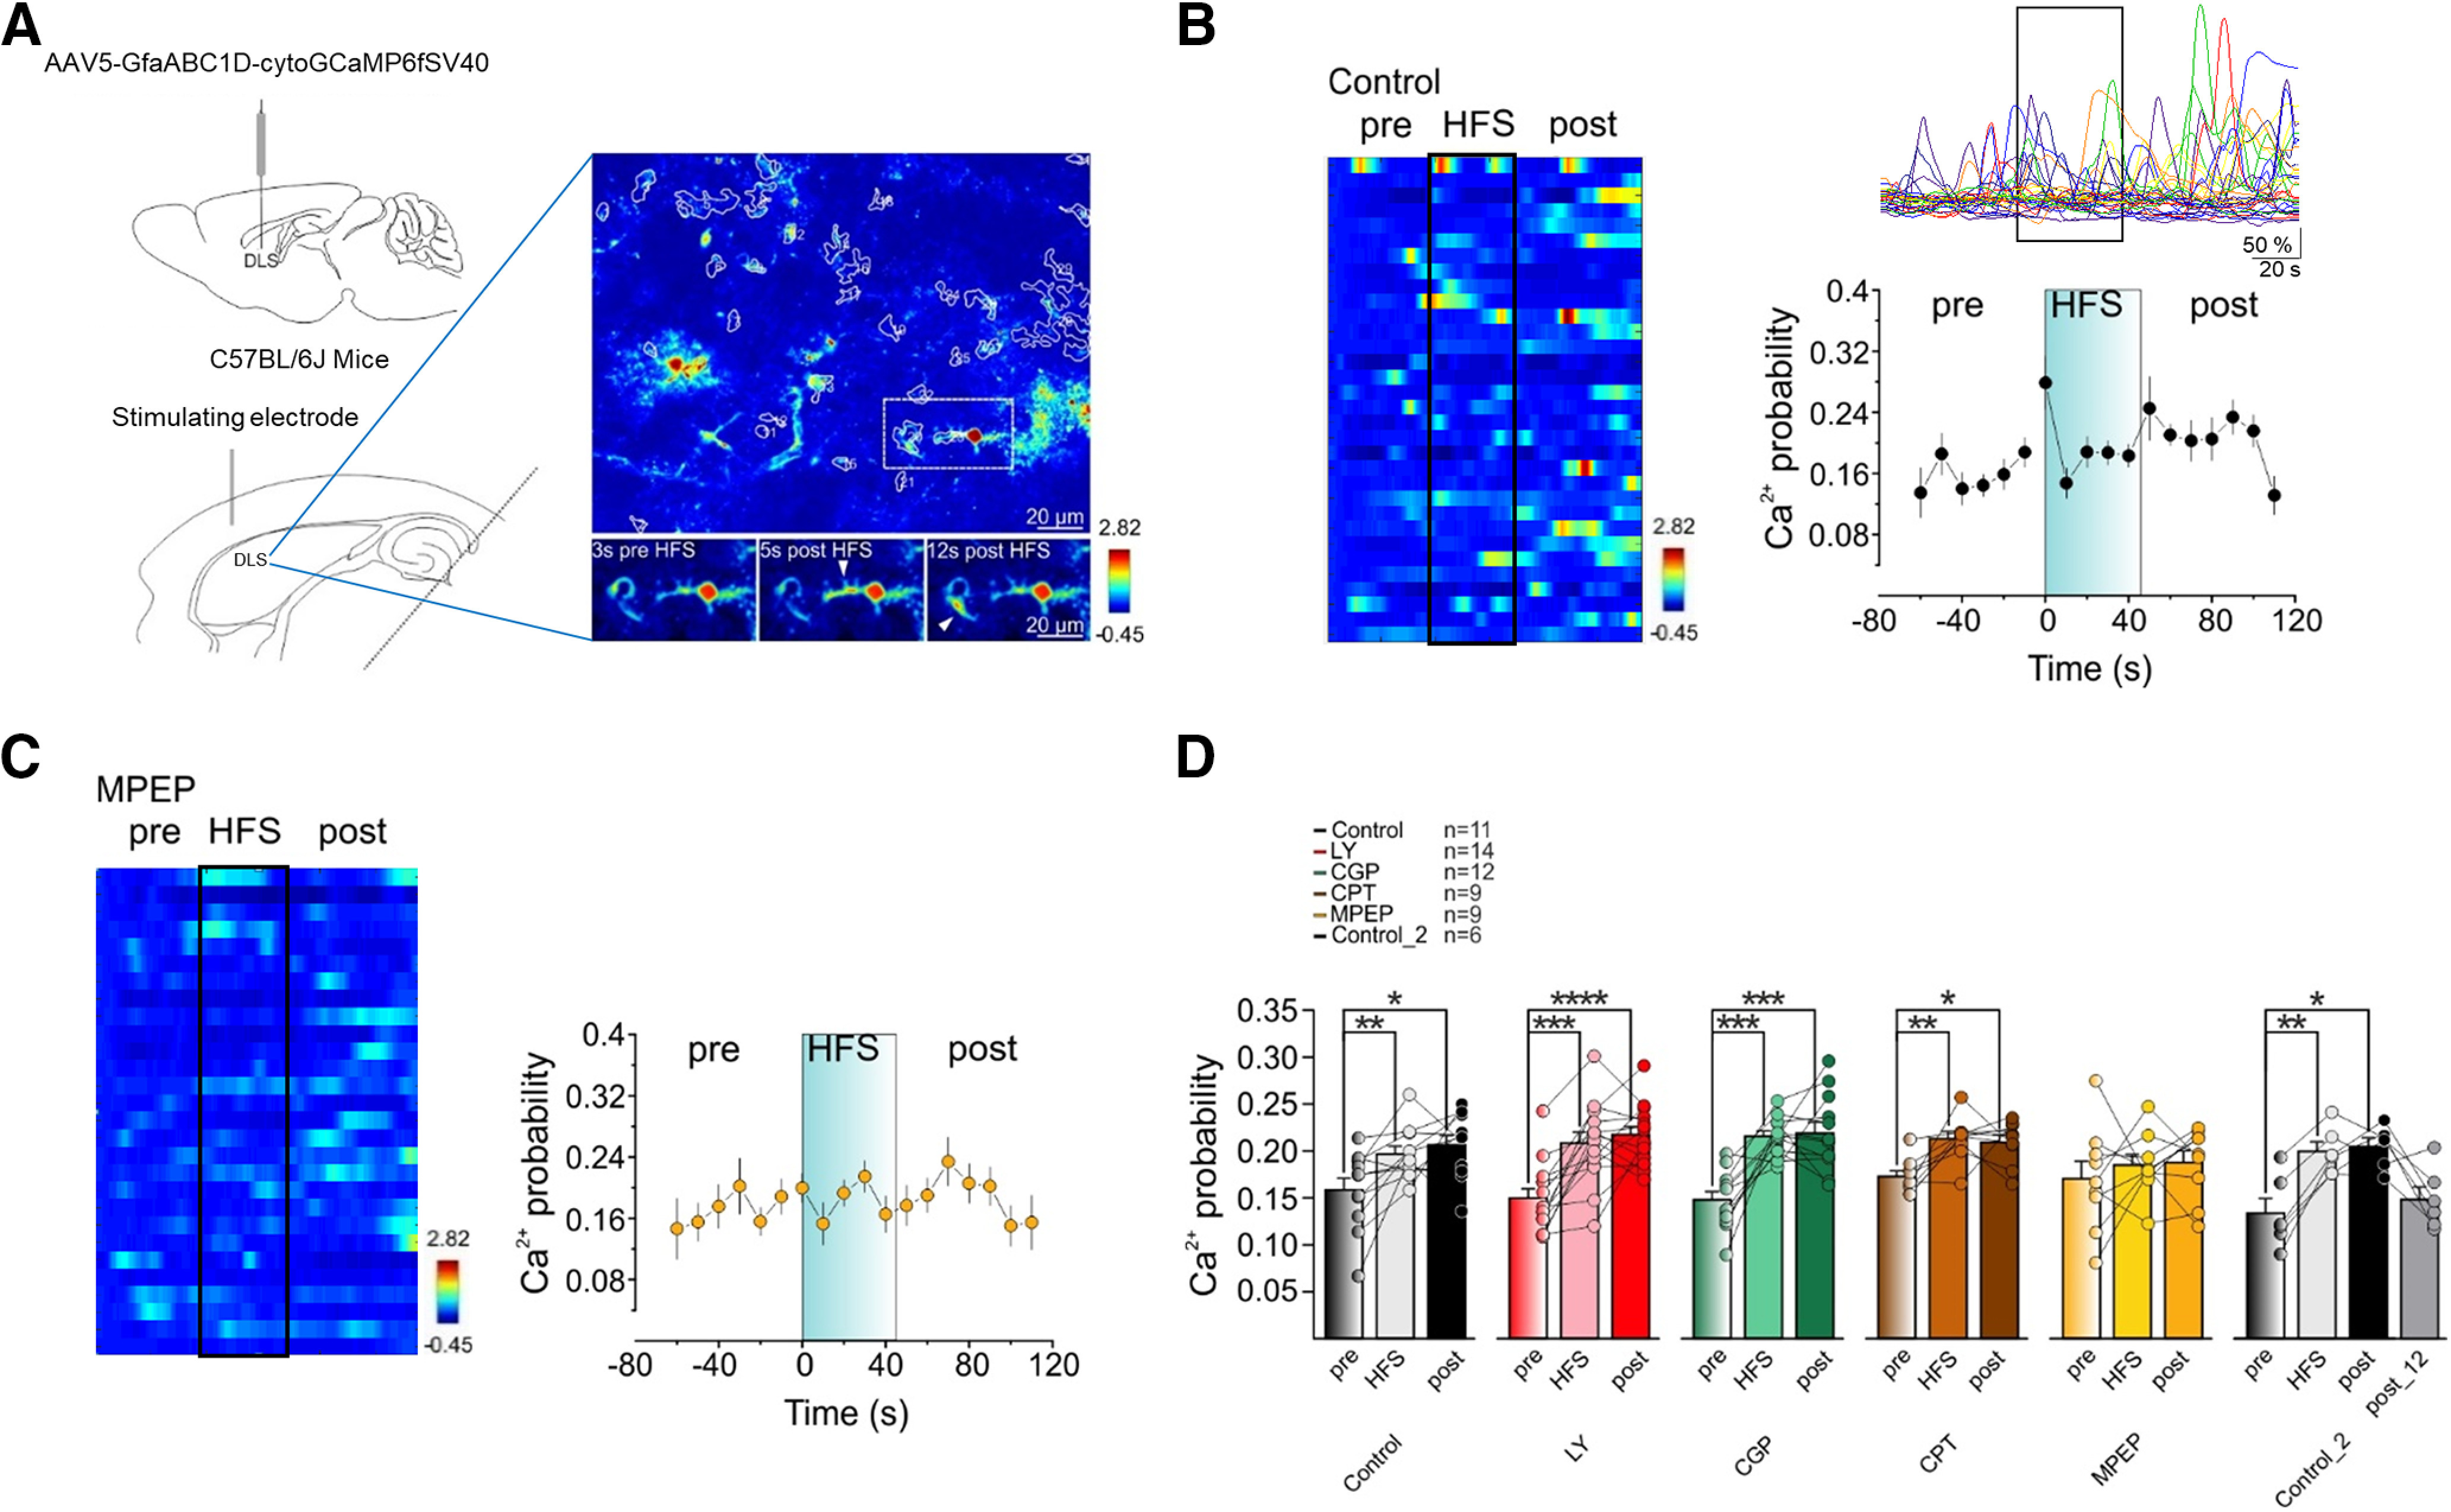
Figure 2.

Cortical HFS enhances Ca2+ transients in DLS astrocytes through mGluR5 activation. A, top left, C57Bl/6J mice received bilateral DLS injection of the genetically-encoded cytosolic Ca2+ indicator GCaMP6f under the astrocyte GfaABC1D promoter (AAV5.G, faABC1D.cytoGCaMP6f.SV40). Bottom left, Scheme of experimental configuration for two-photon Ca2+ imaging measurements in DLS astrocytes of horizontal brain slices. Right, Representative image of ROIs automatically generated by CALSEE in control conditions. B, Representative heatmap (left) and traces (top right) of Ca2+ fluorescence from ROIs (y-axis in left) before (pre), during (HFS, black box, as in other panels), and after (post) HFS delivery in control conditions. Bottom right, Time course of Ca2+ event probability averaged in 10-s bins in control conditions before, during, and after HFS delivery. C, left, Representative heatmap of Ca2+ traces from ROIs (y-axis) before, during, and after HFS delivery in the presence of MPEP. Right, Time course of Ca2+ event probability averaged in 10-s bins in MPEP group before, during, and after HFS delivery. D, Mean Ca2+ event probability 60 s before HFS (pre), during HFS (HFS), 70 s after HFS (post), and 12 min after HFS delivery (Post_12) in different pharmacological conditions (black, control, n = 11, 5 mice, pre vs HFS vs post, RM1WA, F(10,20) = 9.082, **p = 0.0019, Dunnett; red, LY, n = 14, 3 mice, RM1WA, F(13,26) = 24.27, ****p < 0.0001, Dunnett; green, CGP, n = 12, 2 mice, RM1WA, F(11,22) = 24.35, ****p < 0.0001, Dunnett; brown, CPT, n = 9, 2 mice, RM1WA, F(8,16) = 8.736, **p = 0.003, Dunnett; yellow, MPEP, n = 9, 2 mice, RM1WA, F(8,16) = 0.6, p = 0.5; black, Control_2, n = 6, 2 mice, RM1WA, F(5,15) = 14.63, **p = 0.0029, Dunnett). Data are presented as mean ± SEM. *p < 0.05, **p < 0.01, ***p < 0.001, and ****p < 0.0001.
