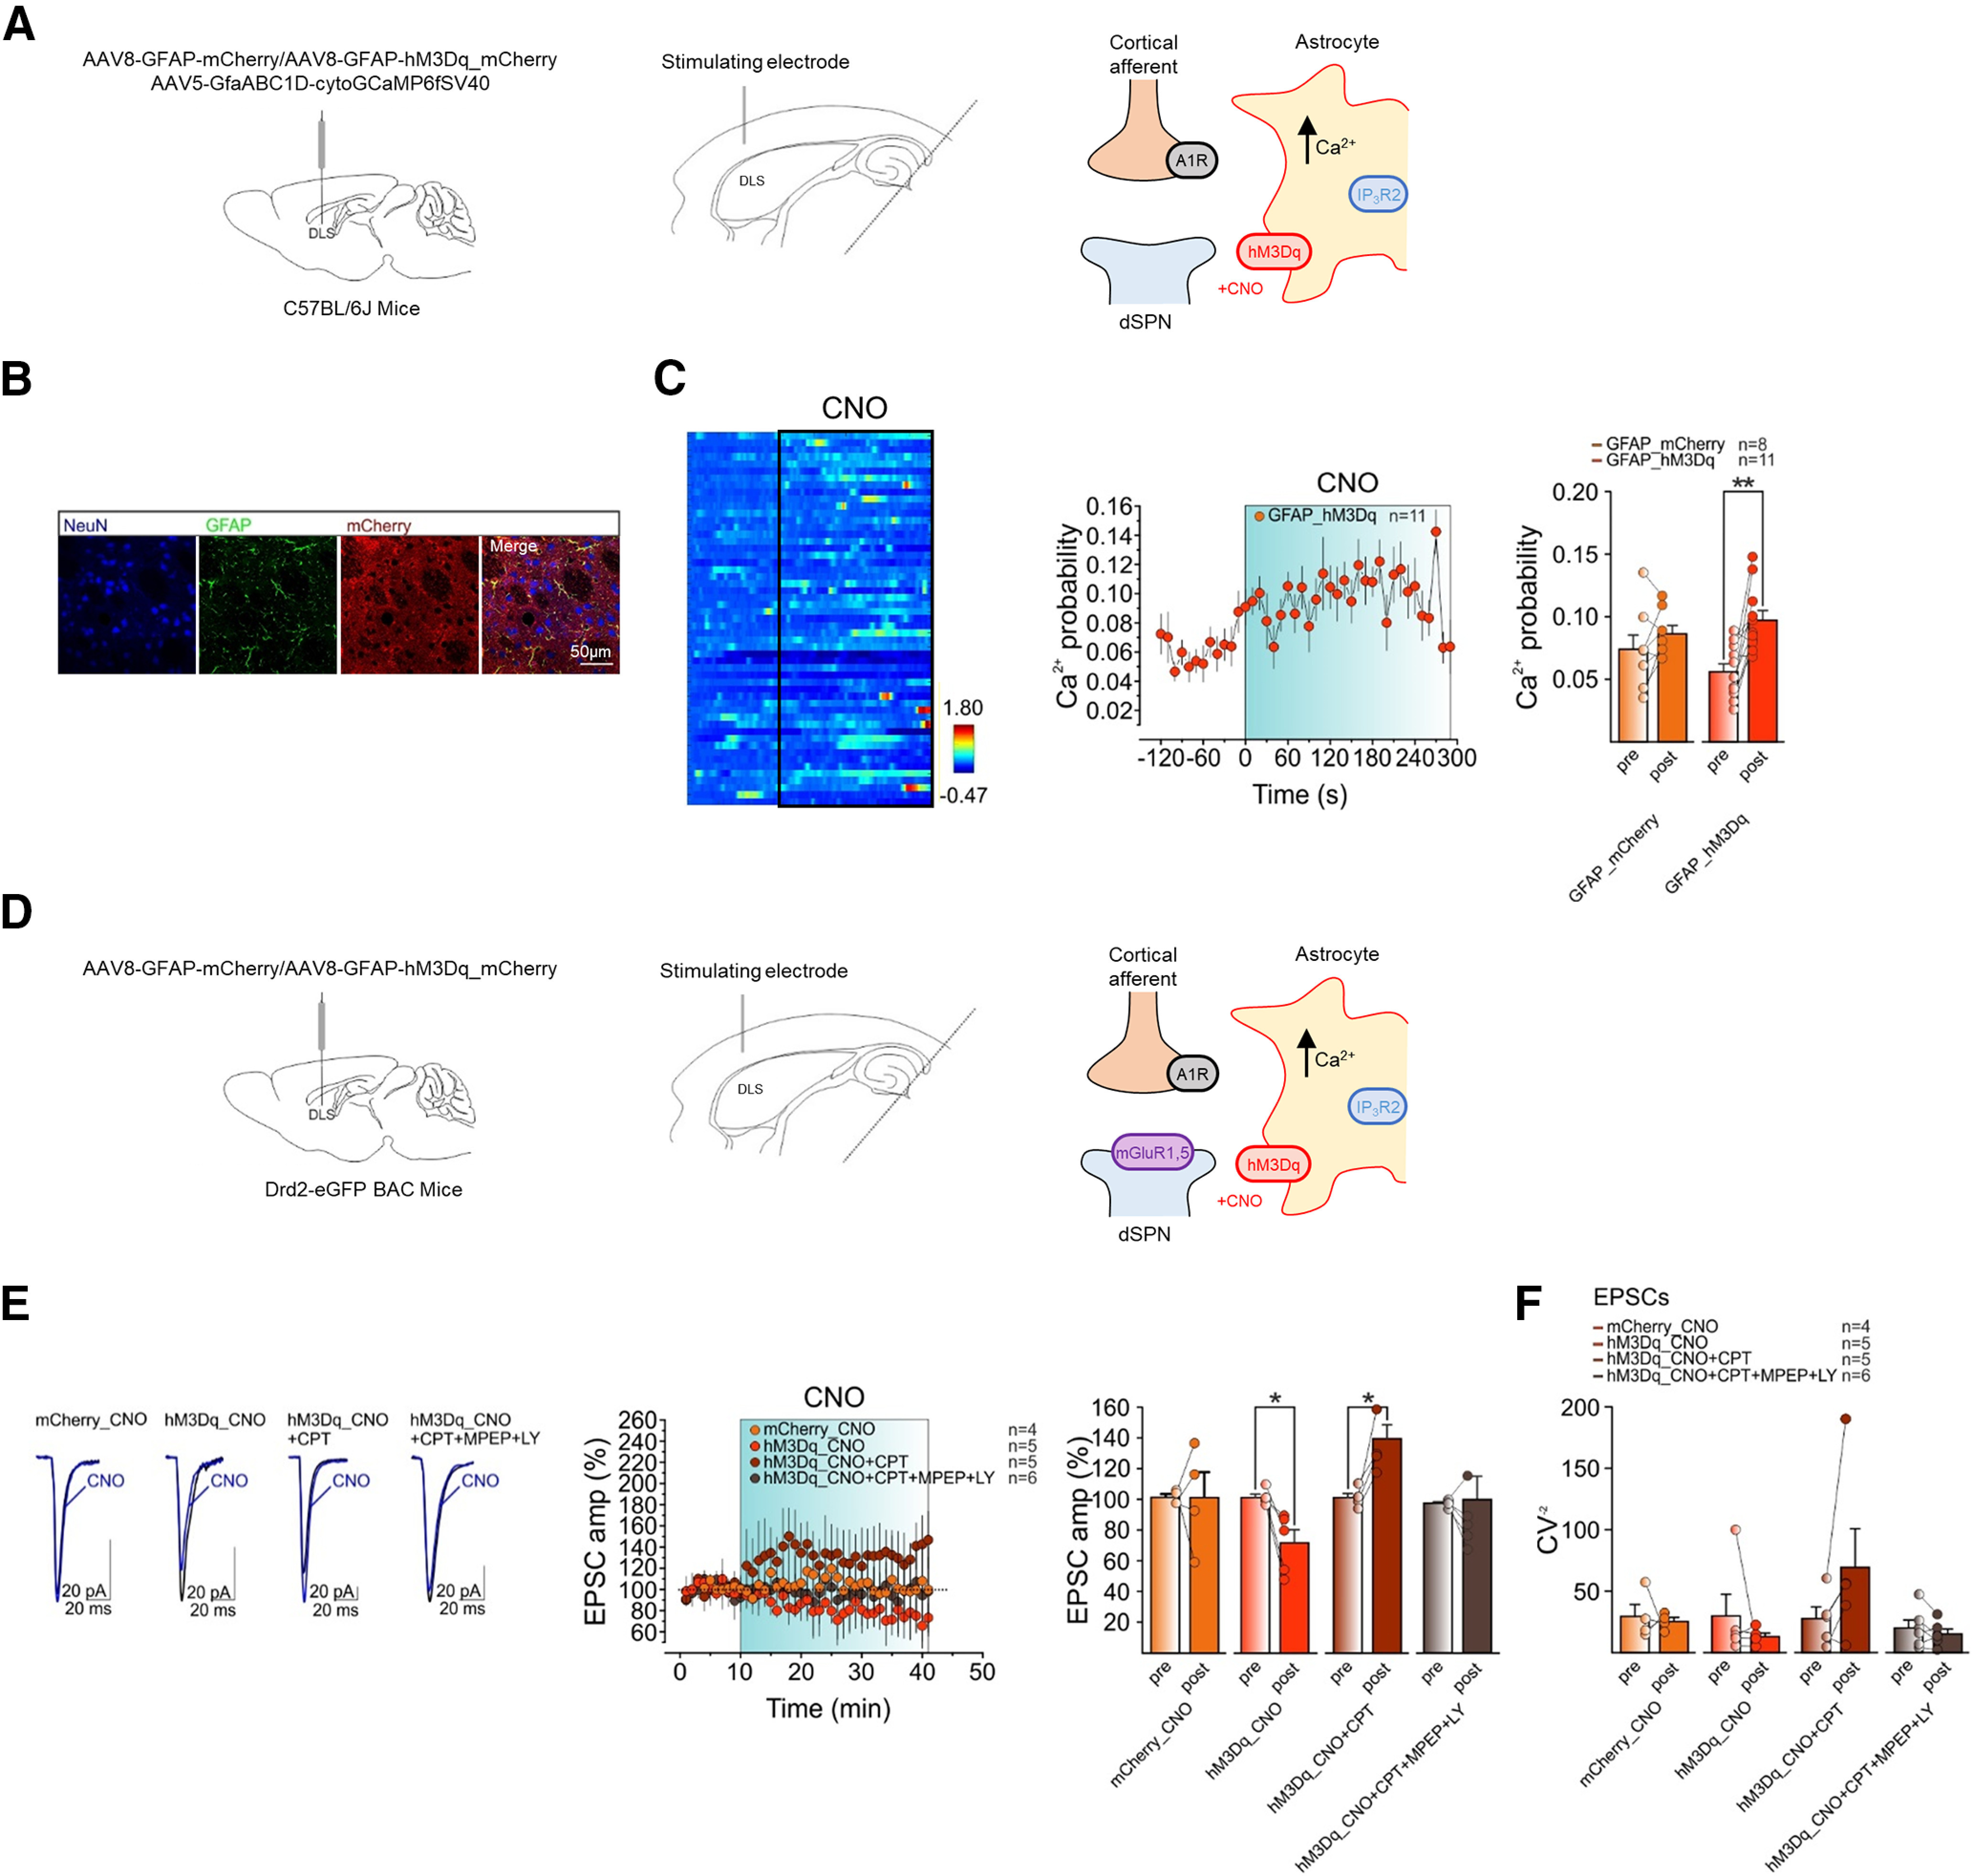
Figure 5.

Astrocyte Gq DREADD activation induces A1R-dependent LTD at cortico-dSPN synapses. A, left, C57BL/6J mice received bilateral DLS injection of AAV5-GfaABC1D-cytoGCaMP6fSV40 along with either AAV8-GFAP-mCherry (control condition) or AAV8-GFAP-hM3Dq-mCherry virus. Middle, Schematic of experimental configuration for two photon Ca2+ imaging measurements in DLS astrocytes of horizontal brain slices. Right, Scheme of the molecular mechanisms regulating synaptic plasticity at tripartite synapses in C57Bl/6J mice with astrocyte-specific Gq DREADDs. B, Confocal laser scanning microscope image of immunohistochemistry showing colocalization of hM3Dq-mCherry with the astrocytic marker GFAP, but not with the neuronal marker NeuN. C, left, Representative heatmap of Ca2+ traces from ROIs before and during CNO bath application in mice expressing AAV8-GFAP-hM3Dq-mCherry. Middle, Time course of Ca2+ event probability before and after (last 4 min) CNO bath application in mice expressing AAV8-GFAP-hM3Dq-mCherry. Right, mean Ca2+ event probability before (pre) and after (post) CNO bath application in mice expressing AAV8-GFAP-mCherry (control condition; orange, n = 8, 2 mice, t = 1.5, df = 7, p = 0.2, paired t test) or AAV8-GFAP-hM3Dq-mCherry (red, n = 11, 2 mice, t = 4, df = 10, **p = 0.002, paired t test). D, left, Drd2_eGFP mice received bilateral DLS injection of AAV8-GFAP-mCherry (control condition) or AAV8-GFAP-hM3Dq-mCherry virus. Middle, Scheme of experimental condition. Right, Scheme of the molecular mechanisms regulating synaptic plasticity at tripartite synapses in C57Bl/6J mice with astrocyte-specific Gq DREADDs. E, left, Averaged recordings (10 EPSCs) before (black) and after (blue) CNO bath application. Middle, Relative EPSC amplitudes before and after CNO bath application in mice expressing AAV8-GFAP-mCherry (orange, n = 4, 3 mice), or in mice expressing AAV8-GFAP-hM3Dq-mCherry in control (red, n = 5, 5 mice), in CPT (maroon, n = 5, 4 mice), or in CPT plus MPEP and LY (gray, n = 6, 4 mice). Right, Mean normalized EPSC amplitudes before and after CNO in mice expressing AAV8-GFAP-mCherry (orange, n = 4, 3 mice, W = 0, p > 0.9999, Wilcoxon matched-pairs signed-rank test), or in mice expressing AAV8-GFAP-hM3Dq-mCherry in control (red, n = 5, 5 mice, t = 3.6, df = 4, *p = 0.02, paired t test), in CPT (maroon, n = 5, 4 mice, t = 4.3, df = 4, *p = 0.01, paired t test) or in CPT plus MPEP and LY (gray, n = 6, 4 mice, t = 0.2, df = 5, p = 0.9, paired t test). F, Mean CV−2 before and after CNO in mice expressing AAV8-GFAP-mCherry (orange, n = 4, 3 mice, W = 0, p > 0.9999, Wilcoxon matched-pairs signed-rank test), in mice expressing AAV8-GFAP-hM3Dq-mCherry in control (red, n = 5, 5 mice, W = −7, p = 0.44, Wilcoxon matched-pairs signed-rank test), in CPT (maroon, n = 5, 4 mice, W = 13, p = 0.13, Wilcoxon matched-pairs signed-rank test), or in CPT plus MPEP and LY (gray, n = 6, 4 mice, t = 1.3, df = 5, p = 0.26, paired t test). Data are presented as mean ± SEM.
