
Figure 2.
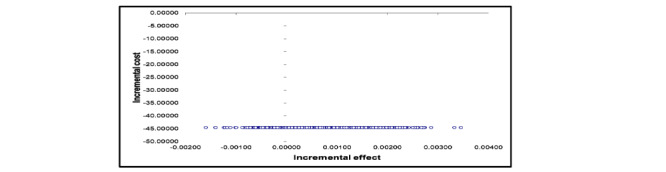
The incremental cost-effectiveness plane for a plot of 1000 bootstrap incremental costs and effects resample means. The blue circles are the plots of 1000 bootstraps incremental costs and effects resample means.
Official websites use .gov
A
.gov website belongs to an official
government organization in the United States.
Secure .gov websites use HTTPS
A lock (
) or https:// means you've safely
connected to the .gov website. Share sensitive
information only on official, secure websites.
The incremental cost-effectiveness plane for a plot of 1000 bootstrap incremental costs and effects resample means. The blue circles are the plots of 1000 bootstraps incremental costs and effects resample means.