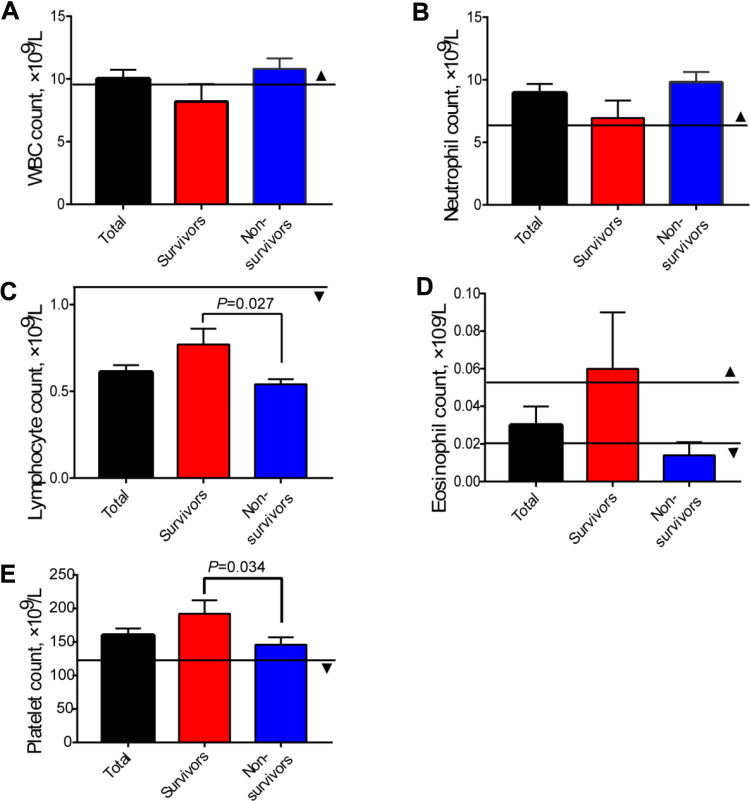
Figure 2.
Differences of blood cell count in total patients, survivors, and non-survivors. (A) White blood cell (WBC count); (B) Neutrophil count; (C) Lymphocyte count; (D) Eosinophil count; (E) Platelet count. The solid lines with ▲ show the upper normal limit of each parameter, and the solid lines with ▼ show the lower normal limit of each parameter. Standard bars represent Mean±SEM.

