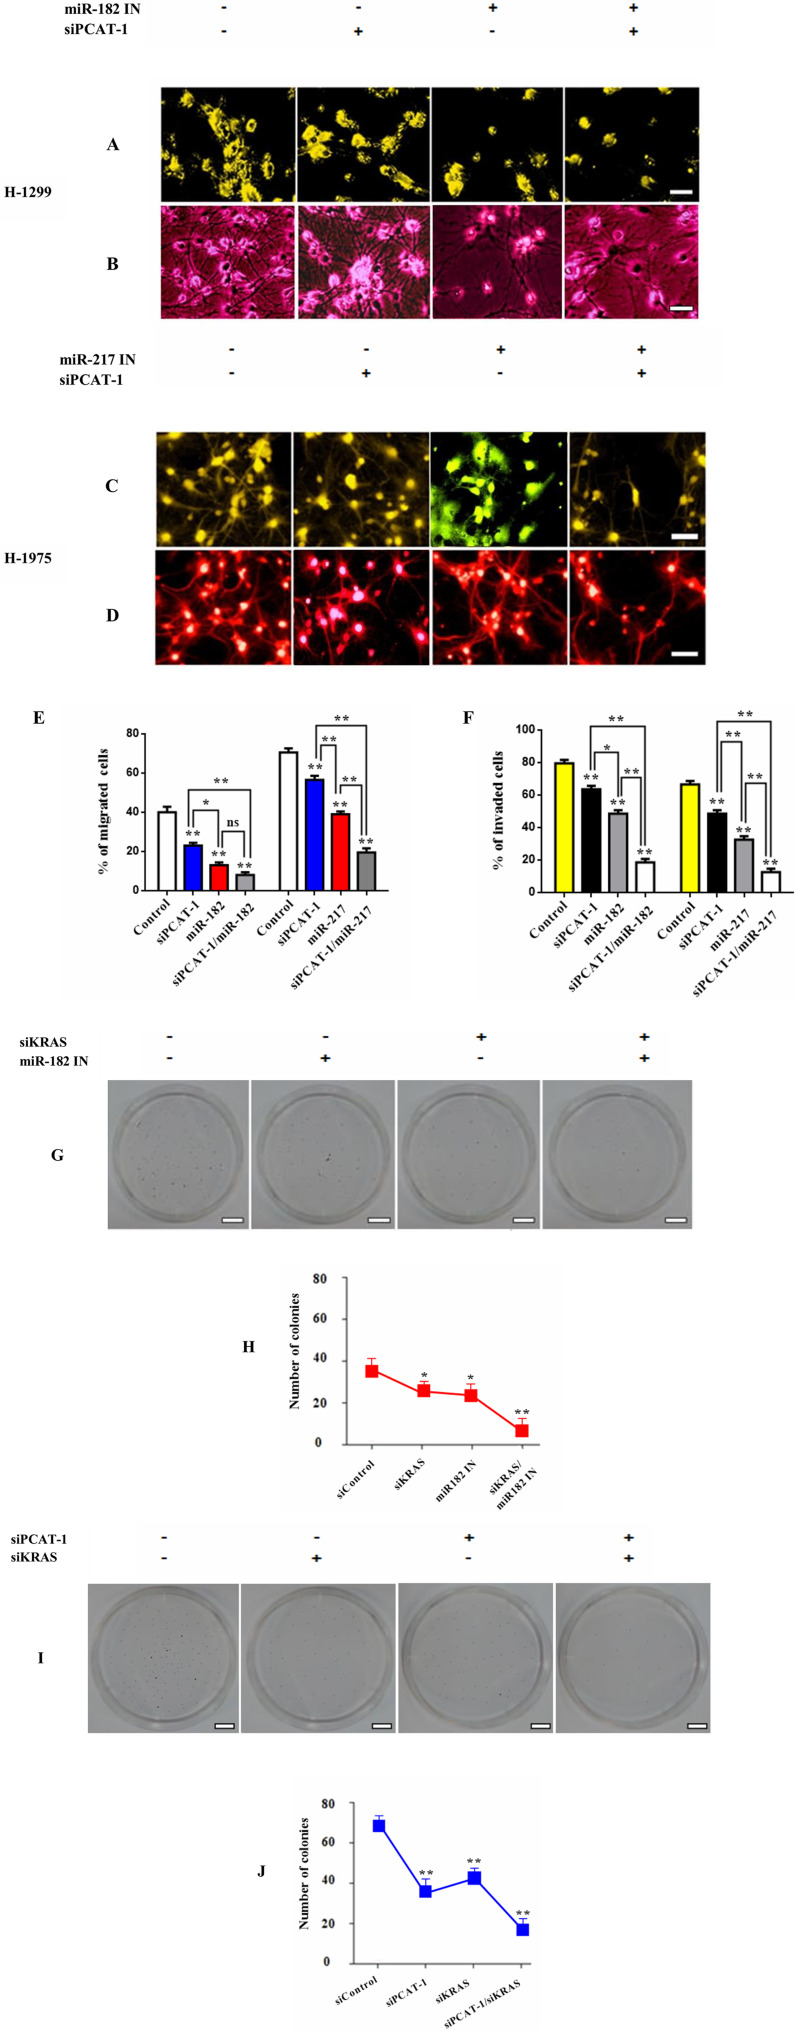
Figure 4. PCAT-1 regulates expression of immunosuppressive miR182/miR-217 signaling axis.
(A–B) Representative images from migration and invasion assays of H1299 cells after transfection with siRNA against PCAT-1 (4 μg) and miR-182 inhibitor (25 μΜ) for 24 h. (C–D) Representative images from migration and invasion assays of H1975 cells after transfection with siRNA against PCAT-1 (4 μg) and miR-217 inhibitor (25 μΜ) for 24 h. (E–F) Quantitative analysis of migration and invasion assays following cell transfection. The results represent the mean ± SD of three independent experiments. (G–H) Colony formation assay of H1975 cells after transfection with siRNA against KRAS (4 μg) and miR-182 inhibitor (25 μΜ) for 24 h. (I–J) Colony formation assay of H1975 cells following co-transfection with siRNAs against KRAS (4 μg) and PCAT-1 (4 μg) for 24 h. Differences were considered statistically significant at p < 0.05. Statistically significant data are indicated by asterisks (* P < 0.05, ** P < 0.01).

