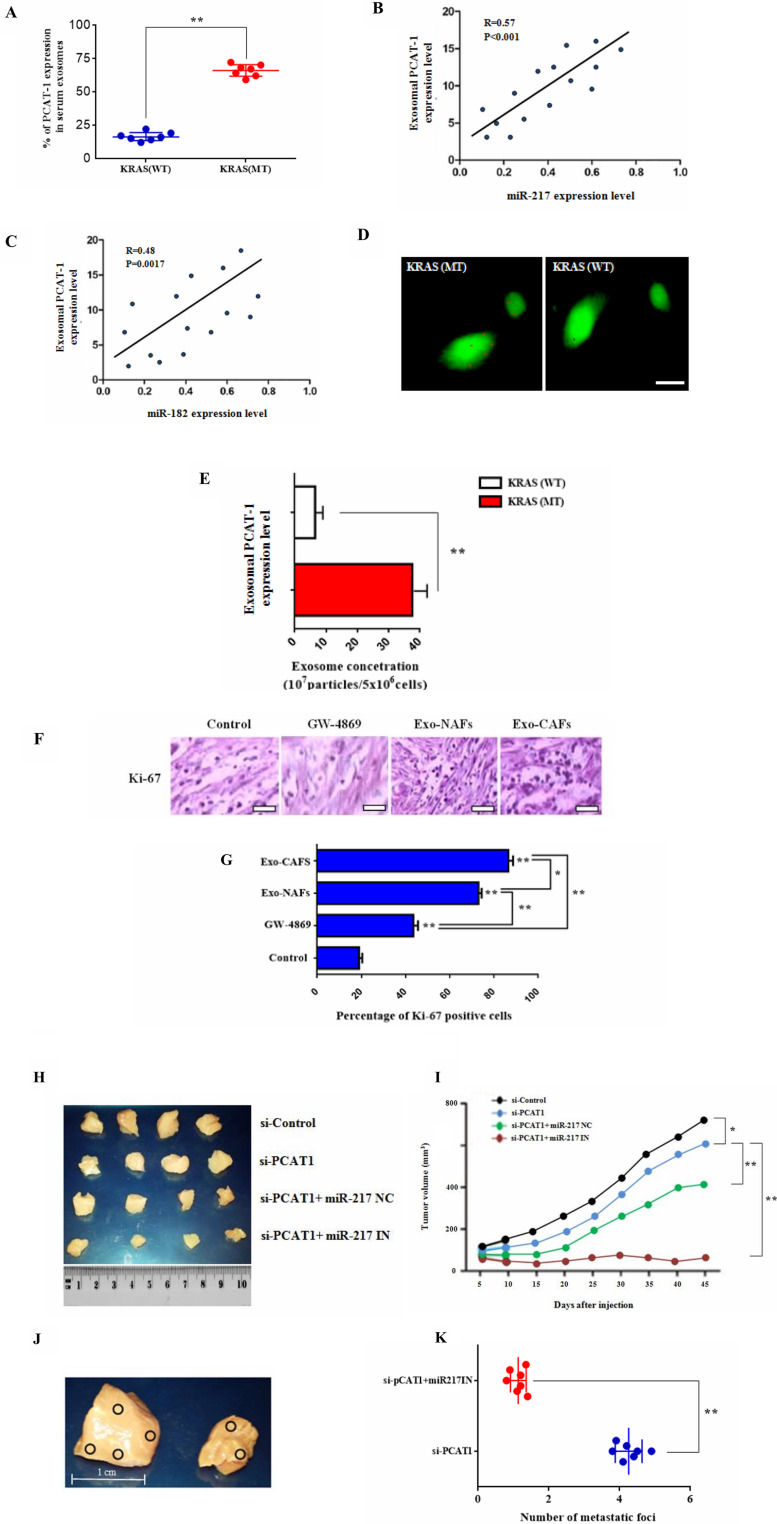
Figure 6. Exosomal PCAT-1 promotes tumor growth and guides lymph node metastasis in vivo.
(A) Levels of PCAT-1 in serum exosomes were measured using RT-PCR. (B–C) Graph showing positive correlation between the miR-182/miR-217 ratio and exosomal PCAT-1 levels. Degree of correlation was higher in miR-217 in comparison with miR-182 (R = 0.57 vs R = 0.48) (D) Uptake of PKH67-labeled exosomes by LC/DR cells. Confocal microscopy image of PKH67-labeled cells (green) and exosomes (red). Images were captured using Carl Zeiss fluorescence confocal microscope. (E) Exosomal concentration of Kras (WT/MT) cells. Data represent the mean ± SD of three independent experiments (* P < 0.05; ** P < 0.01). (F) Immunohistochemical staining for Ki-67 in lung biopsies from control subjects and biopsies treated with exosomes and GW-4869. Sections of human lung biopsies were obtained from patients with lung cancer and following Kras/exosome inhibition treatment (50 μΜ, 1 h). Human Ki-67, was detected using anti-human monoclonal antibody. Staining with mouse IgG1 isotype was used as the negative control. (G) Quantification of immunohistochemistry by the intensity of the positive immunosignals in the tissue sections are showed in histograms (* P < 0.05, ** P < 0.01). Images were obtained through a Carl Zeiss microscope using image analysis software (Scale bar, 50 μm). Stained tumor cells are shown at a final magnification (×400). (H) Representative photographs of excised tumors from mice after treatment with siPCAT-1 and miR-217 inhibitor. (I) Tumor growth curve of mice treated in the different groups. Survival rates of tumor-bearing mice after a 60-day tumor challenge in each group. Data were given as the mean ± SD (n = 6) (* P < 0.05, ** P < 0.01). (J) In vivo metastatic analysis of lymph node metastasis from siPCAT-1 and siPCAT-1/miR-217 IN-treated groups. Images showed representative lymph node metastatic foci highlighted in yellow from different groups. (K) Statistical analysis of the number of metastatic foci of each group. Data represent the mean ± SD of three independent experiments. Differences were considered statistically significant at p < 0.05. Statistically significant data are indicated by asterisks (* P < 0.05, ** P < 0.01).

