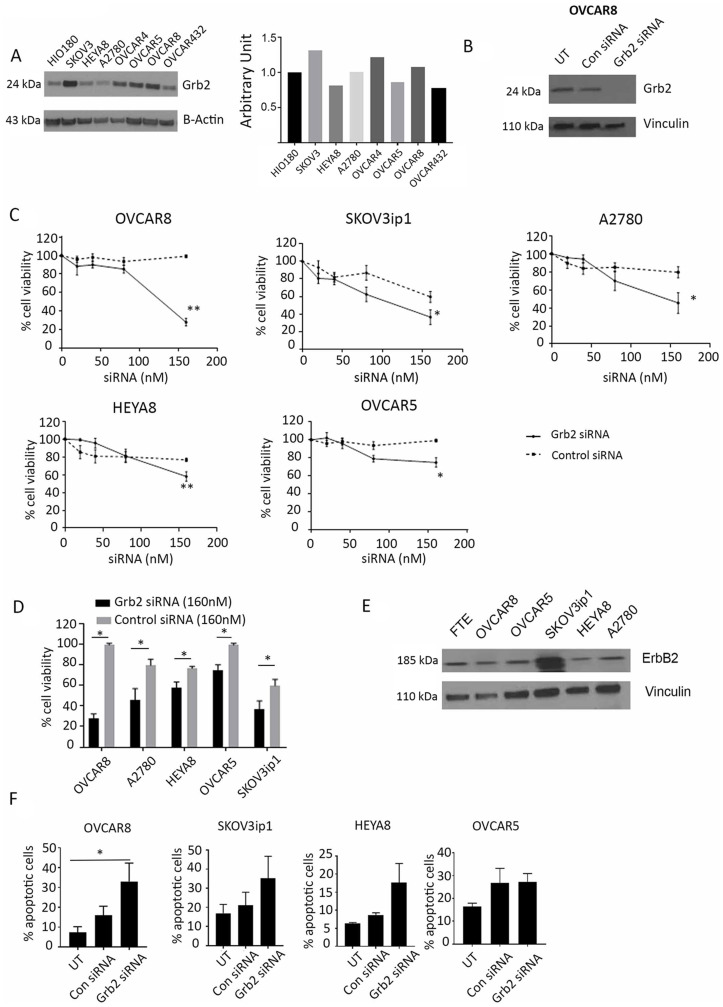
Figure 2. Effect of Grb2 downregulation on ovarian cancer cell lines.
(A) Western blot analysis of Grb2 expression in a panel of ovarian cancer cell lines compared with that in the non-transformed epithelial ovarian cell line HIO180. The adjoining graph shows their expression compared with that in HIO180. (B) Western blot analysis of Grb2 expression in OVCAR8 cells 72 hours after siGrb2 (Grb2 siRNA) cells compared with that in untreated (UT) and siControl (Con siRNA) cells. (C) OVCAR8, SKOV3ip1, A2780, HEYA8, and OVCAR5 cell lines were transfected with siGrb2 or siControl at increasing concentrations. An alamarBlue assay of the cells was performed 72 hours after transfection to determine their percent viability, which is shown in the graphs. The data represent averages of triplicate measurements. (D) The percent viability of the five cell lines shown in panel C, 72 hours after transfection of siGrb2 and siControl at 160 nM. (E) Western blot analysis of erbB2 expression in a panel of ovarian cancer cell lines compared to fallopian tubal epithelium (FTE). (F) Results of an annexin V assay performed to determine the number of apoptotic untreated (UT), siControl-transfected (100 nM), and siGrb2-transfected (100 nM) ovarian cancer cells. The assay was performed 72 hours after transfection. Error bars, SEM. All statistical tests were two-sided. Asterisk indicates statistical significance of ** p < 0.01, * p < 0.05.

