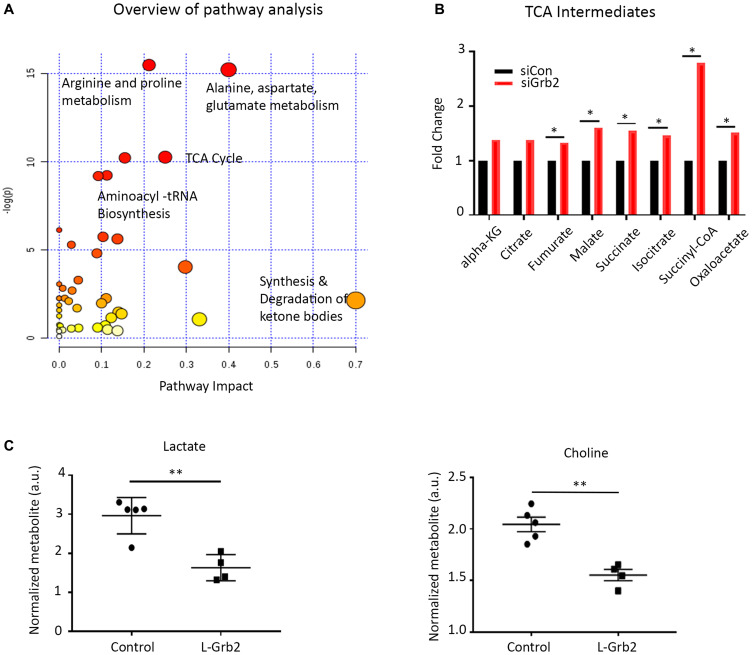
Figure 4. Effect of Grb2 downregulation on metabolite levels in ovarian cancer cells.
(A) Metabolites analyzed using the pathway analysis module of MetaboAnalyst. TCA, tricarboxylic acid; tRNA, transfer RNA. (B) TCA metabolite levels in OVCAR8 ovarian cancer cells after siGrb2 and siControl transfection. (C) Effect of Grb2 downregulation on lactate and choline levels in ovarian tumors. Mass spectroscopy was used to quantify metabolite levels in OVCAR5 tumors collected at the conclusion of an in vivo therapeutic experiment from control mice and mice given L-Grb2 based monotherapy (n = 5). Error bars, SEM. All statistical tests were two-sided. Asterisk indicates statistical significance of ** p < 0.01, * p < 0.05.

