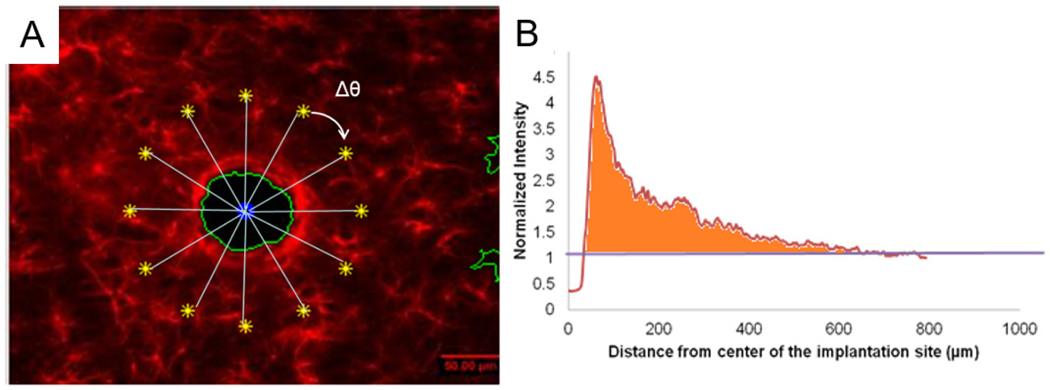
Figure 4.
(A) Schematic of the rotational intensity sweep profile anaysis. (B) Represensative data showing normalized intensity versus distance from the center of the implantation site. The intensity values were normalized by the undamaged area, which was denoted with a value of 1. Area under the curve and above 1 was obtained to indicate the relative image area where the cell density was greater compared to the undamaged area within the region of interest.

