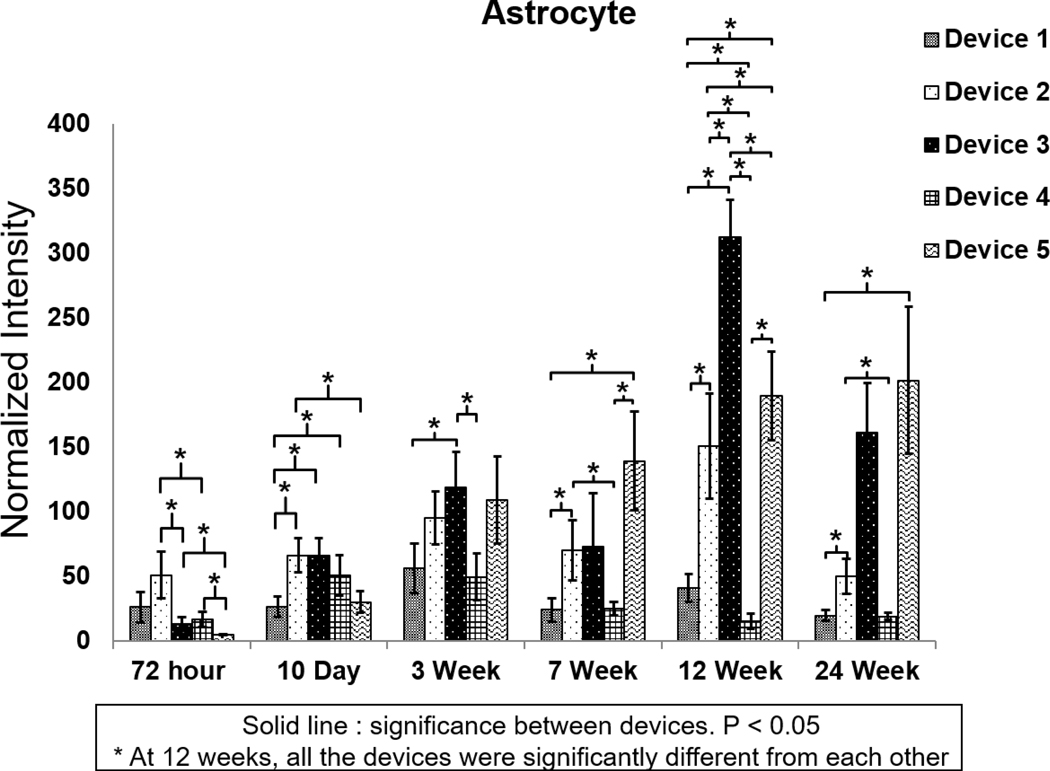
Figure 6.
(A) Normalized GFAP intensity at different time points for the five probe groups. *Significance between different groups (p < 0.05). **Significance between different groups (p < 0.01). ***Significance between different groups (p < 0.001). GFAP intensity over the distance from the center of the implantation site for different groups. (B) 72 h post device implantation. (C) 24 weeks post device implantation. The shaded area represents the standard error for each data point.

