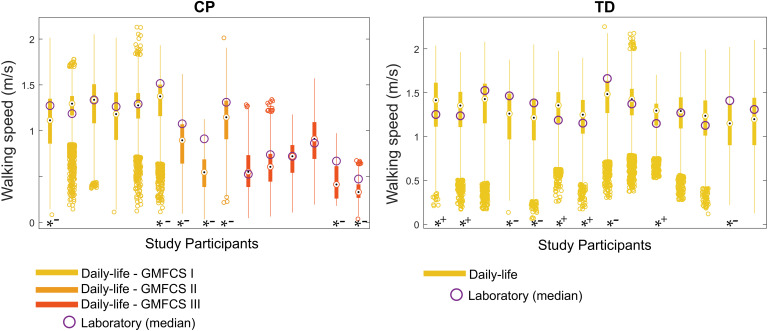
FIGURE 6.
Intra-subject comparisons between laboratory and daily life. Daily life speed distribution is represented by the box plots. Stars at the bottom of the box plots stand for significant difference between distributions, tested by unpaired Wilcoxon tests (*–: Lab > Daily life; *+: Lab < Daily life) for each study participant. Abbreviations: CP: Cerebral palsy; TD: Typical development; GMFCS: Gross Motor Function Classification System.

