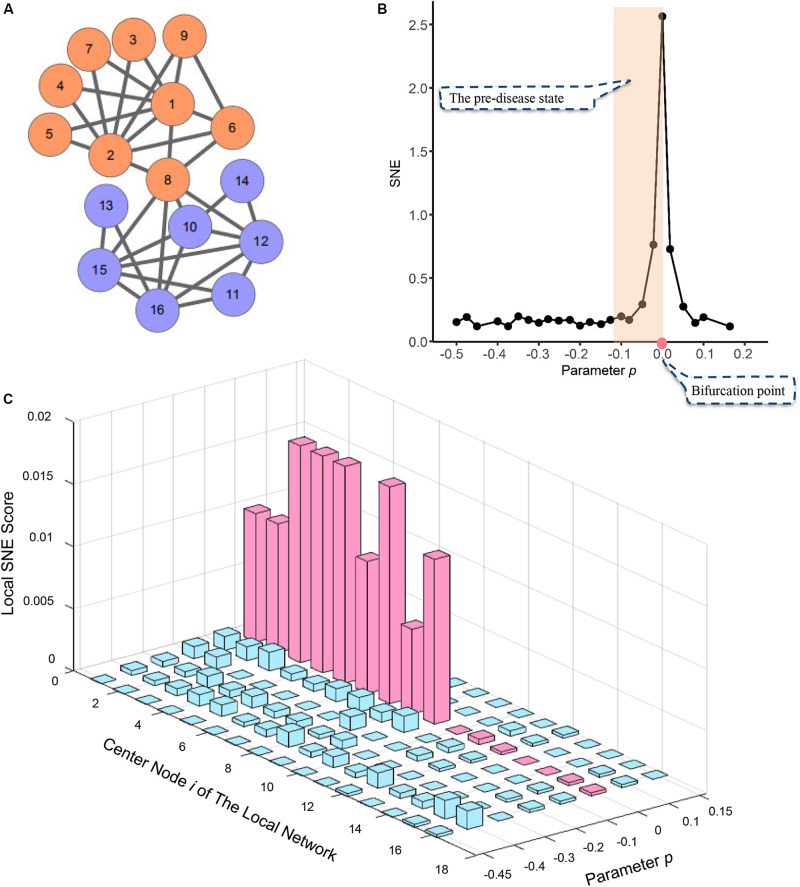
FIGURE 2.
The application of SNE method in numerical simulation. (A) The numerical simulation is based on a model of a 16-node regulatory network. (B) The curve of SNE score H defined in Eq. (3) suddenly increases when the system is near the critical point (p = 0), which is viewed as a state transition at a bifurcation point. (C) The graph shows the dynamical changes of local SNE score defined as in Eq. (2) respectively, for 16 local networks. It can be seen that those local networks centered in the DNB members drastically increase when the system is near the critical point at p = 0, which provides the early warning signals of the imminent critical transition.

