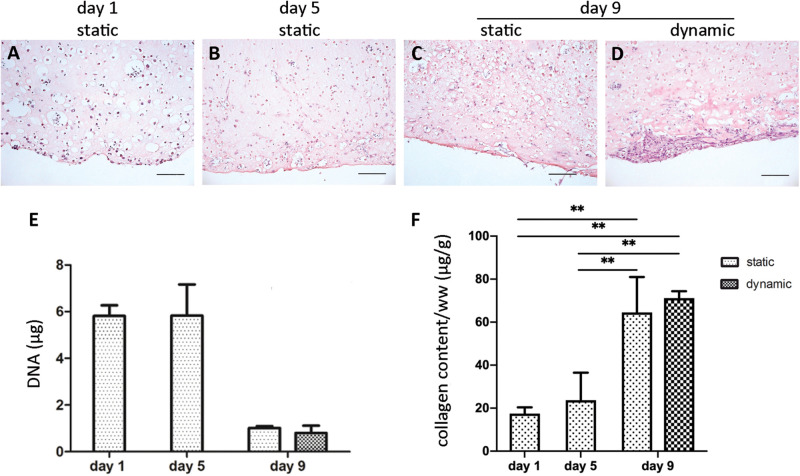
FIGURE 3.
ECT cell distribution and DNA and collagen content. Representative H&E staining showing cell distribution within an explanatory ECT at the beginning (day 1) of the culture (A), at day 5 (B), and following either static (C) or dynamic (D) culture at day 9. Scale bar = 100 μm. Graphs showing the DNA amount (E) and the collagen content normalized by ww (F) for ECTs at the beginning (day 1) of the culture, at day 5, and following either static or dynamic culture (day 9). For all groups n = 3, ∗∗p ≤ 0.01.

