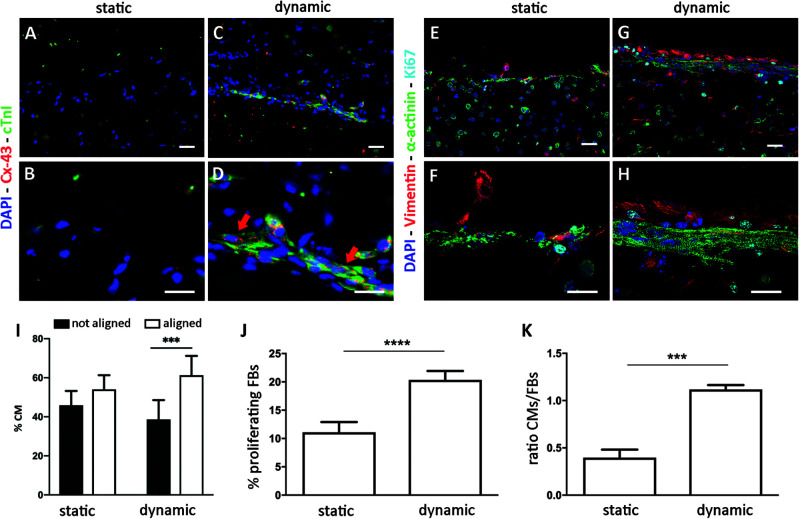
FIGURE 4.
ECT biological characterization. Representative immunofluorescence images of statically (A,B,E,F) and dynamically (C,D,G,H) cultured ECTs at low (A,C,E,G, scale bar = 30 μm) and high (B,D,F,H, scale bar = 10 μm) magnification, stained for cardiac markers connexin-43 (Cx-43, red), Troponin I (cTnI, green), and α-sarcomeric actinin (α-actinin, green); for FB marker Vimentin (red); and for proliferating marker Ki67 (cyan). Nuclei are stained with DAPI (blue). (I) Graph showing the percentage of CMs aligned and not aligned with the direction of the mechanical stimulation, for statically (n = 3) and dynamically (n = 4) cultured ECTs. (J) Graph showing the percentage of proliferating FBs in statically and dynamically cultured ECTs at day 9. (K) Graph showing the ratio of CMs and FBs in statically and dynamically cultured ECTs at day 9. For all groups, n = 3, ∗∗∗p ≤ 0.001; ****p ≤ 0.0001.

