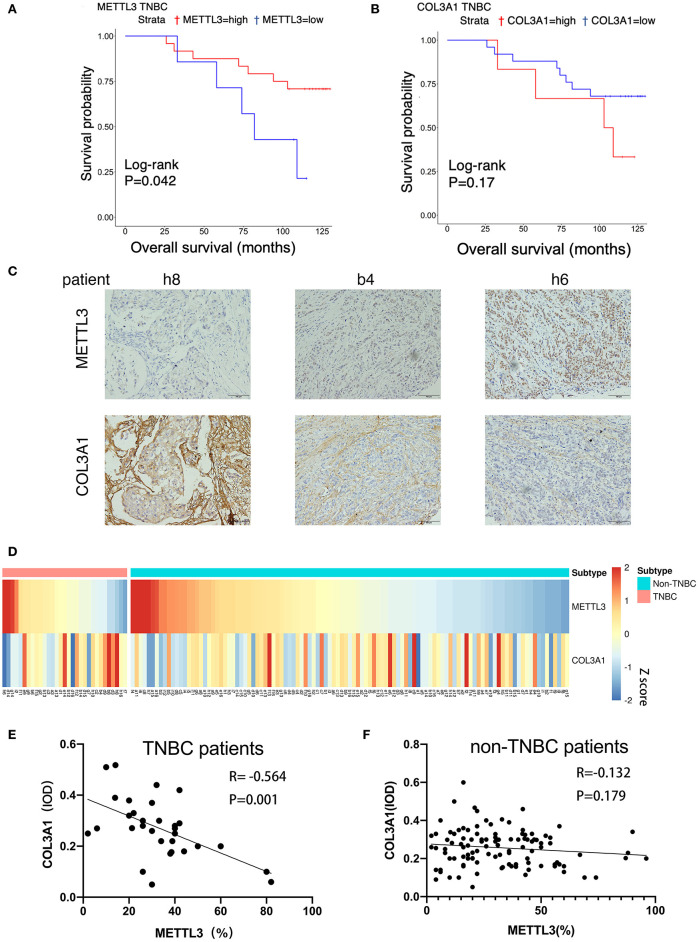
Figure 7.
The correlation between METTL3 and COL3A1 in breast cancer patients. (A,B) Kaplan–Meier analysis for the OS of METTL3 and COL3A1 in TNBC patients of the TMA sections. (C) The expression of METTL3 and COL3A1 detected by IHC in the representative samples of breast cancer. h8, low expression of METTL3 and high expression of COL3A1. b4, middle expression of METTL3 and COL3A1. h6, high expression of METTL3 and low expression of COL3A1. Original magnification, 200×. (D) Heatmap of the expression level of METTL3 and COL3A1 protein in breast cancer patients. (E,F) Correlation of METTL3 and COL3A1 in human TNBC patients (n = 31) and non-TNBC patients (n = 109), respectively, in TMA sections.

