
Figure 2.
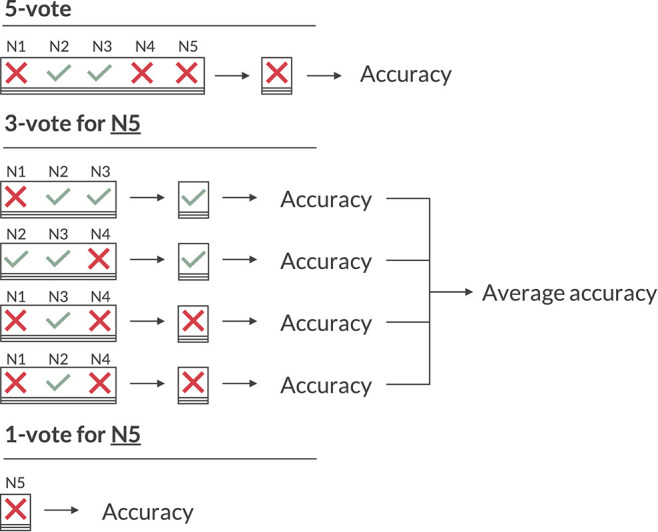
Illustration of the various voting schemes when calculating the accuracy. The 5-vote indicates how one would evaluate the model on the majority vote of the five neurologists (N1 to N5). The 3-vote illustrates how one would evaluate N5 (and similarly for N1-4). The 1-vote illustrates how one would evaluate the model on the labels of just one neurologist (in this case N5).