
Figure 3.
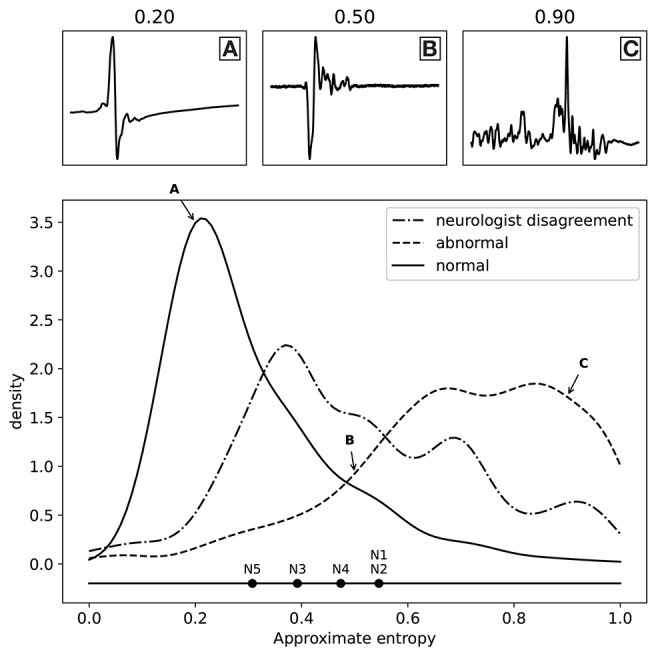
Distribution of the labels (normal and abnormal) as a function of approximate entropy, as well as the distribution of MEPTS (motor evoked potential time series) with the most disagreement among the neurologists (i.e., those where there is a 2 against 3 vote). The distributions are made using a Gaussian kernel of width 0.05. To illustrate what various values of approximate entropy look like, a few samples are shown, taken from the distribution at the locations indicated by the A, B, and C labels (approximate entropy equal to 0.2, 0.5, and 0.9, respectively). The individual thresholds of the experts are also shown to illustrate the thresholding problem.