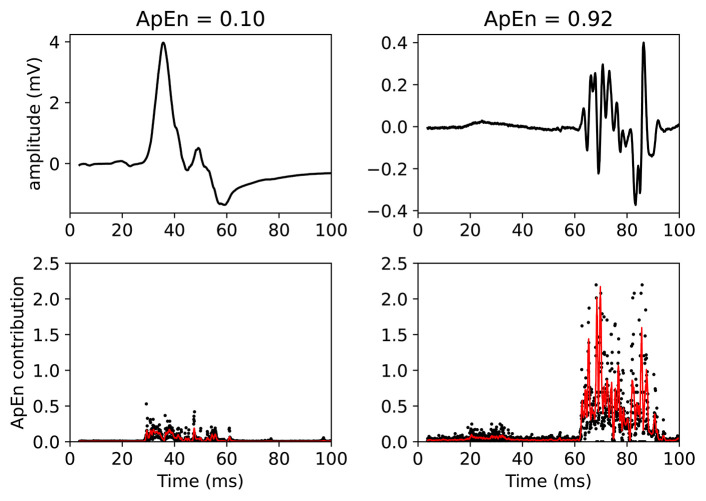
Figure 5.
Example of two MEPTS (motor evoked potential time series) with low (left) and high (right) ApEn (approximate entropy). The time series are shown in the upper figures, while the ApEn contributions are shown in the lower figures. Each point of the time series has a corresponding ApEn contribution. A moving average of 11 points is also shown (red line). The final ApEn value is the average of all contributions. Note that the final ApEn value is normalized between 0 and 1.

