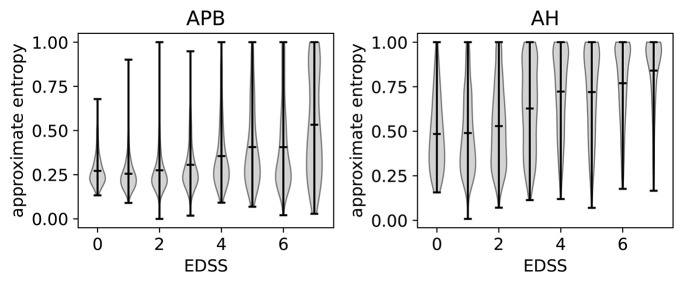
Figure 7.
Violin plots to show the correlation between EDSS (expanded disability status scale) and the approximate entropy. We show separate plots for the hands (APB) and feet (AH) as the distributions are quite disparate. Time series with EDSS > 7.5 have been discarded as there are too few to be statistically relevant.

