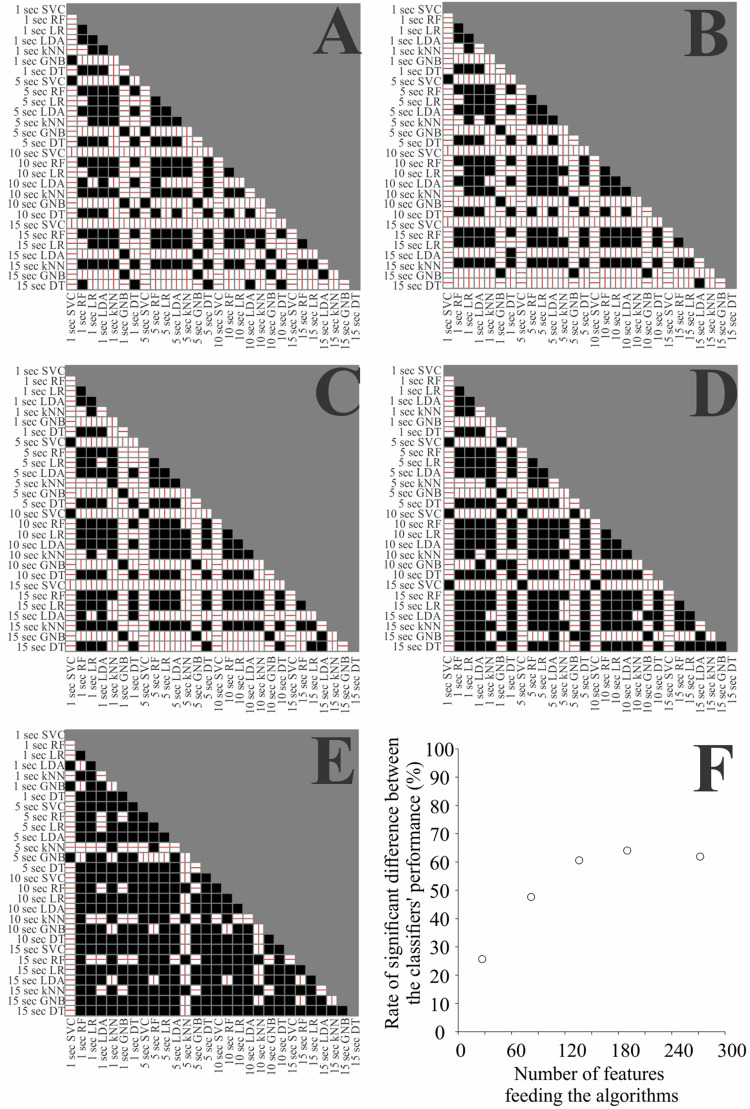
FIGURE 6.
Comparison of the classifier’s performance in the testing phase when using all the features (A), 70% (B), 50% (C), 30% (D), and 10% (E) of the features. White squares represent the significant difference between the classifiers on the respective row and column, while black squares represent non-significance for the comparison. The line in the white squares represent the direction of the difference, horizontal lines indicates that the classifier on the row had higher accuracy than the classifier on the column, and vertical lines represent the opposite. (F) Number of significant differences between two classifiers as a function of number of features.

