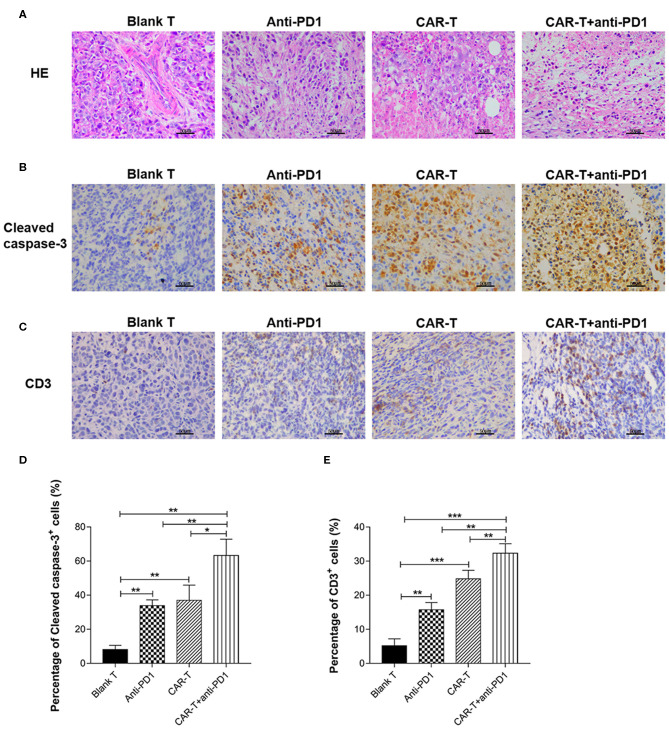
Figure 8.
The syngeneic tumor tissue observed by microscope after HE staining or immunohistochemical staining and the quantification of cleaved caspase-3 and CD3 expression. (A) The tissue sections of syngeneic tumors were stained by HE and observed by microscope (400×). Scale bar is 50 μm. (B) The tissue sections (five tissue sections for each mouse) of syngeneic tumors were stained by immunohistochemistry for cleaved caspase-3 expression and observed by microscope (400×). The slides were incubated with rabbit anti-mouse cleaved caspase-3 antibody. Scale bar is 50 μm. (C) The tissue sections (five tissue sections for each mouse) of syngeneic tumors were stained by immunohistochemistry for CD3 expression and observed by microscope (400×). The slides were incubated with rabbit anti-mouse CD3ε antibody. Scale bar is 50 μm. (D) For quantification of immunohistochemical staining, cleaved caspase-3 positive cells were counted in five random 400× microscopic fields for each tissue section. (E) For quantification of immunohistochemical staining, CD3ε-positive cells were counted in five random 400× microscopic fields for each tissue section. CAR-T group compared with blank T group, or CAR-T plus anti-PD1 group compared with anti-PD1 group, or anti-PD1 group compared with blank T group, or CAR-T plus anti-PD1 group compared with CAR-T group, or CAR-T plus anti-PD1 group compared with blank T group, *P < 0.05, **P < 0.01, ***P < 0.001. The experiments have been repeated for three times. CAR, chimeric antigen receptor; Luc, luciferase; CAR-T, T cells transduced with CAR; Blank T, T cells not transduced.

