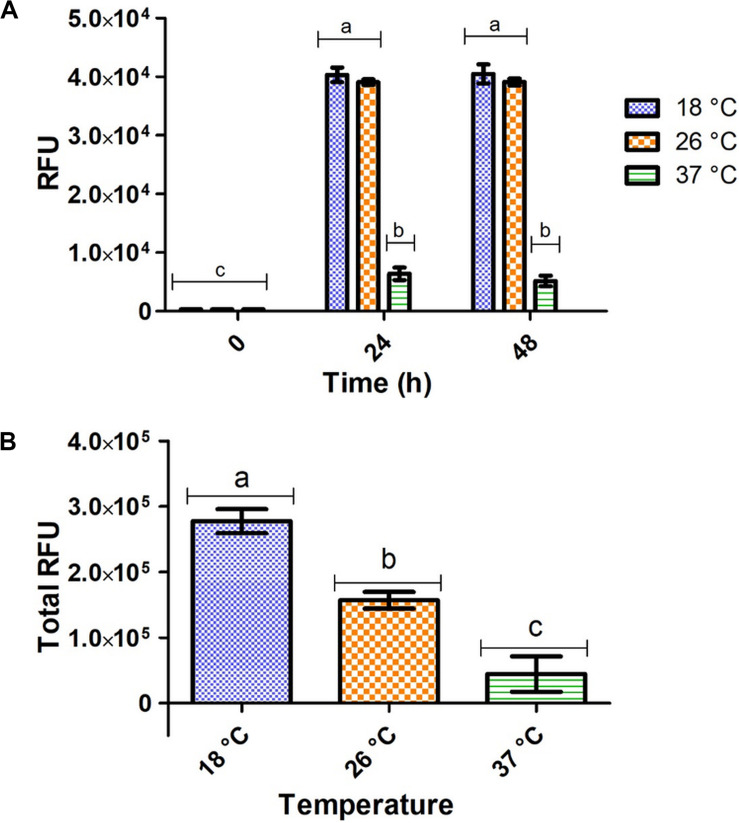
FIGURE 2.
Fluorometric intensity of E. coli pRSF-GFP-MunEx expressing GFP-MunEx at 18, 26, and 37°C. (A) In vivo fluorometric measurements after 0, 24, and 48 h. (B) The total relative amounts of GFP-MunEx calculated after protein extraction and Ni-NTA purification of the 48 h expression. Fluorometric intensity measured in Relative fluorescent units (RFU). Dissimilar letters on bars indicates means which are significantly different from one another according to Bonferroni post-test (P < 0.05).

