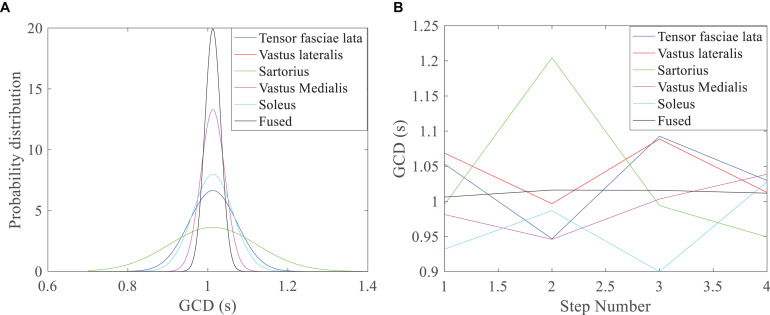
FIGURE 6.
GCD profile of walking under the speed of 1 m/s. (A) Bayesian distribution GCD curves of 5 muscles in one step of walking; the fused GCD has the least SD (gray line), while GCD from the Sartorius has the largest SD (green line); (B) GCDs from different muscles, the Sartorius muscle has the higher variance over different steps (green line), while the fused GCD has the least variance (gray line).

