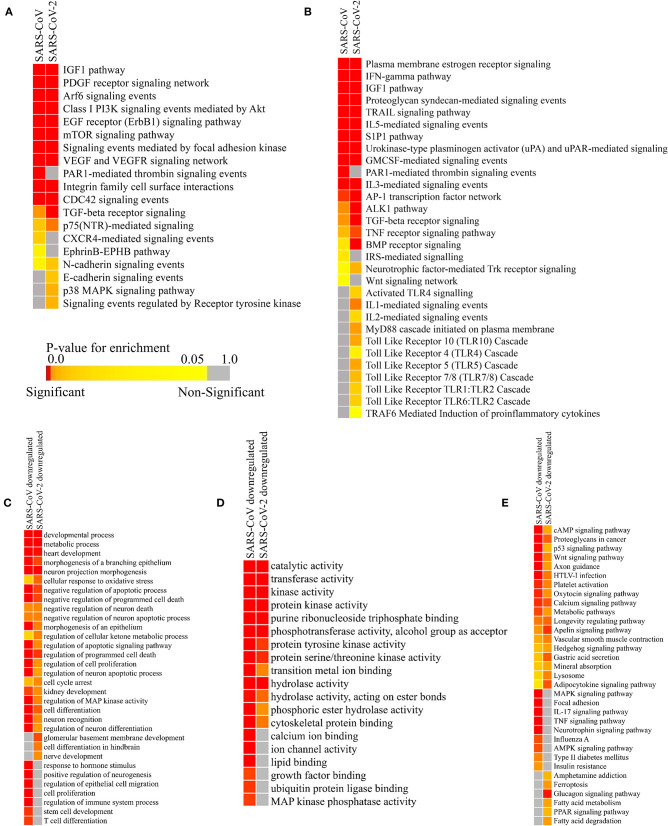
Figure 5.
Enrichment analysis and comparison between host miRNA targets induced by SARS-CoV and SARS-CoV-2 infections. (A) Heatmap representation of enriched pathways involved in host defense obtained using Funrich software. (B) Enriched pathways that might act as proviral mechanisms obtained using Funrich software. Enrichment of downregulated host miRNA target genes in SARS-CoV and SARS-CoV-2 using gitools. (C) GO Biological Process module. (D) GO Molecular Function module. (E) KEGG pathway modules. The significance of enrichment in terms of adjusted p-value (<0.05) is represented in a color-coded P-value scale for all heatmaps. Color toward red indicates higher significance and color toward yellow indicates less significance, while gray means non-significant. Only selected significant enriched terms are shown.

