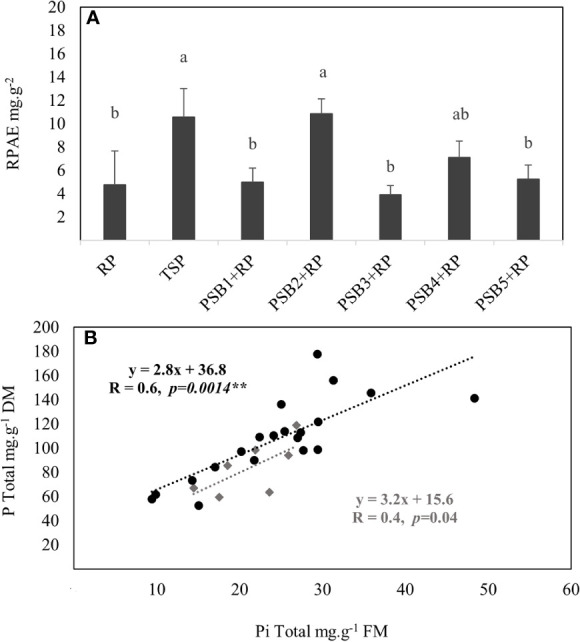
Figure 2.

Variation in root P acquisition efficiency RPAE (A) and the relationship between inorganic P and total P of durum wheat (B) fertilized with rock P in response to inoculation with five PSB isolates versus P (RP and TSP) treatments alone. Error bars represent the standard deviation of four replicates with each replicate consists of eight wheat plants per pot harvested at 42-day after germination. Mean values labeled with the same letter were not significantly different at p < 0.05. In panel (B), black circles: RP-fertilized plants inoculated with five PSB isolates consisting of twenty replicates (four replicates per PSB). Grey squares: RP and TSP fertilized plants consisting of four replicates with each replicate consists of eight wheat plants per pot.
