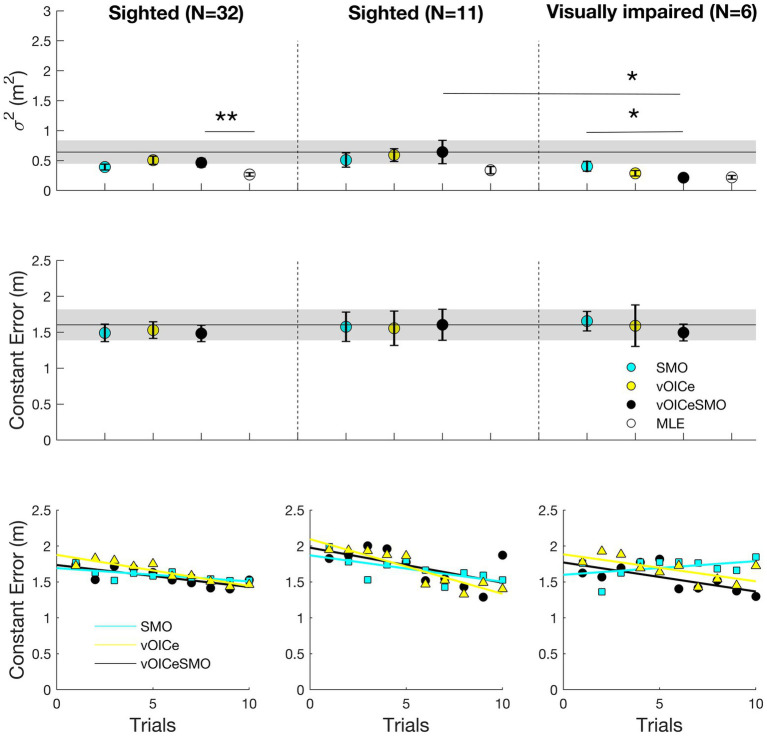
Figure 7.
Average variable error (top panels), constant error (middle panels), and relation between average constant error and number of trials (bottom panels) for the egocentric task. Average results for the entire sighted group (N = 32; left panels), the sighted group that performed the task with the same order of the VI group (N = 11; middle panels), and the VI group (N = 6; right panels). vOICe = vOICe condition alone; SMO = self-motion alone; vOICeSMO = self-motion + vOICe. The marker labeled MLE (in white) in the top panels refers to the reduction in variability predicted by the MLE model. How MLE was calculated is explained in Figure 5 caption. Error bars represent the standard error of the mean, and the shaded dark line represent the combined measure (vOICeSMO) for the 11 sighted (middle panels) as a reference to both the combined conditions of the entire sighted group and of the VI group. ** p < 0.01; * p < 0.05. Please see Supplementary Figure S6 for a boxplot with median and IQR measures.

