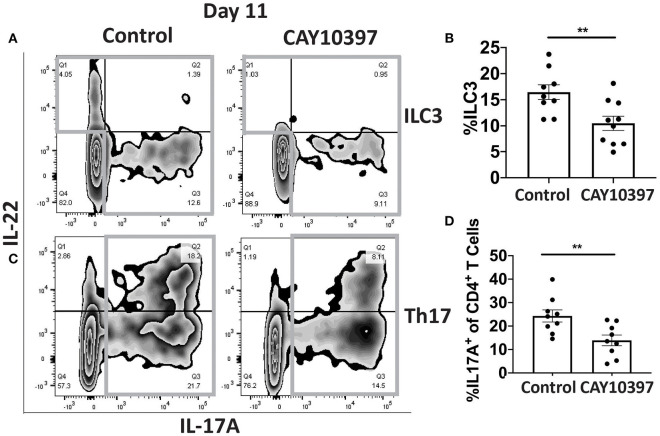
Figure 4.
Inhibition of 15-Pgdh activity in Se-A mice impacts ILC3 and Th17 cells. (A) Representative flow plot and (B) quantification of ILC3s isolated from the cLP on day 11 PI. Gray box around representative flow plots indicate IL-17A+IL-22+ cells. (C) Representative flow plot and (D) quantification of IL-17A+ cells of CD4+ T cells indicating Th17 cells isolated from the cLP on day 11 PI. Gray box around representative flow plots indicate IL-17A+ cells. Data indicate mean ± SEM of two independent experiments and n = 9–10 mice/group; unpaired t-test (B,D) **P < 0.01.

