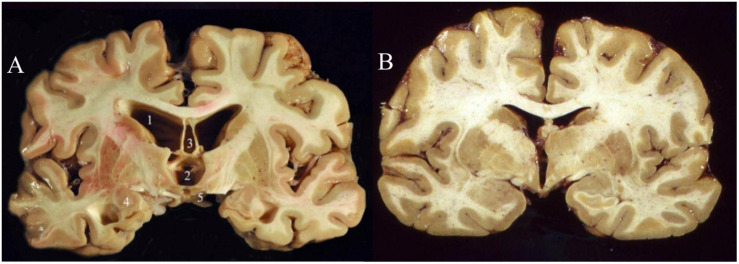
FIGURE 1.
Coronal slices of advanced CTE (A) compared to a normal brain (B). CTE brain shows enlargement of the ventricles (1–2), septum pellucidum (3), medial temporal lobe (4), and mammillary bodies (5) (Stern et al., 2011). Permission obtained from John Wiley and Sons through PM&R Journal. License #: 4730951503528.

